

Zivot–Andrews Test: Unit Roots with One Unknown Break
Learn how the Zivot–Andrews test searches for one unknown break in a unit-root regression, why its minimum statistic needs special critical values, and what its null leaves out
In this guideThe test asks whether one break changes the unit-root conclusion
Short summary
The Zivot–Andrews (ZA) test asks whether a series that looks persistent may instead be stationary around a deterministic path with one break. It fits a unit-root regression across candidate break dates and keeps the most negative lagged-level t-statistic. That date search changes the reference distribution, and the classic test assumes no break under the unit-root null.
The test asks whether one break changes the unit-root conclusion
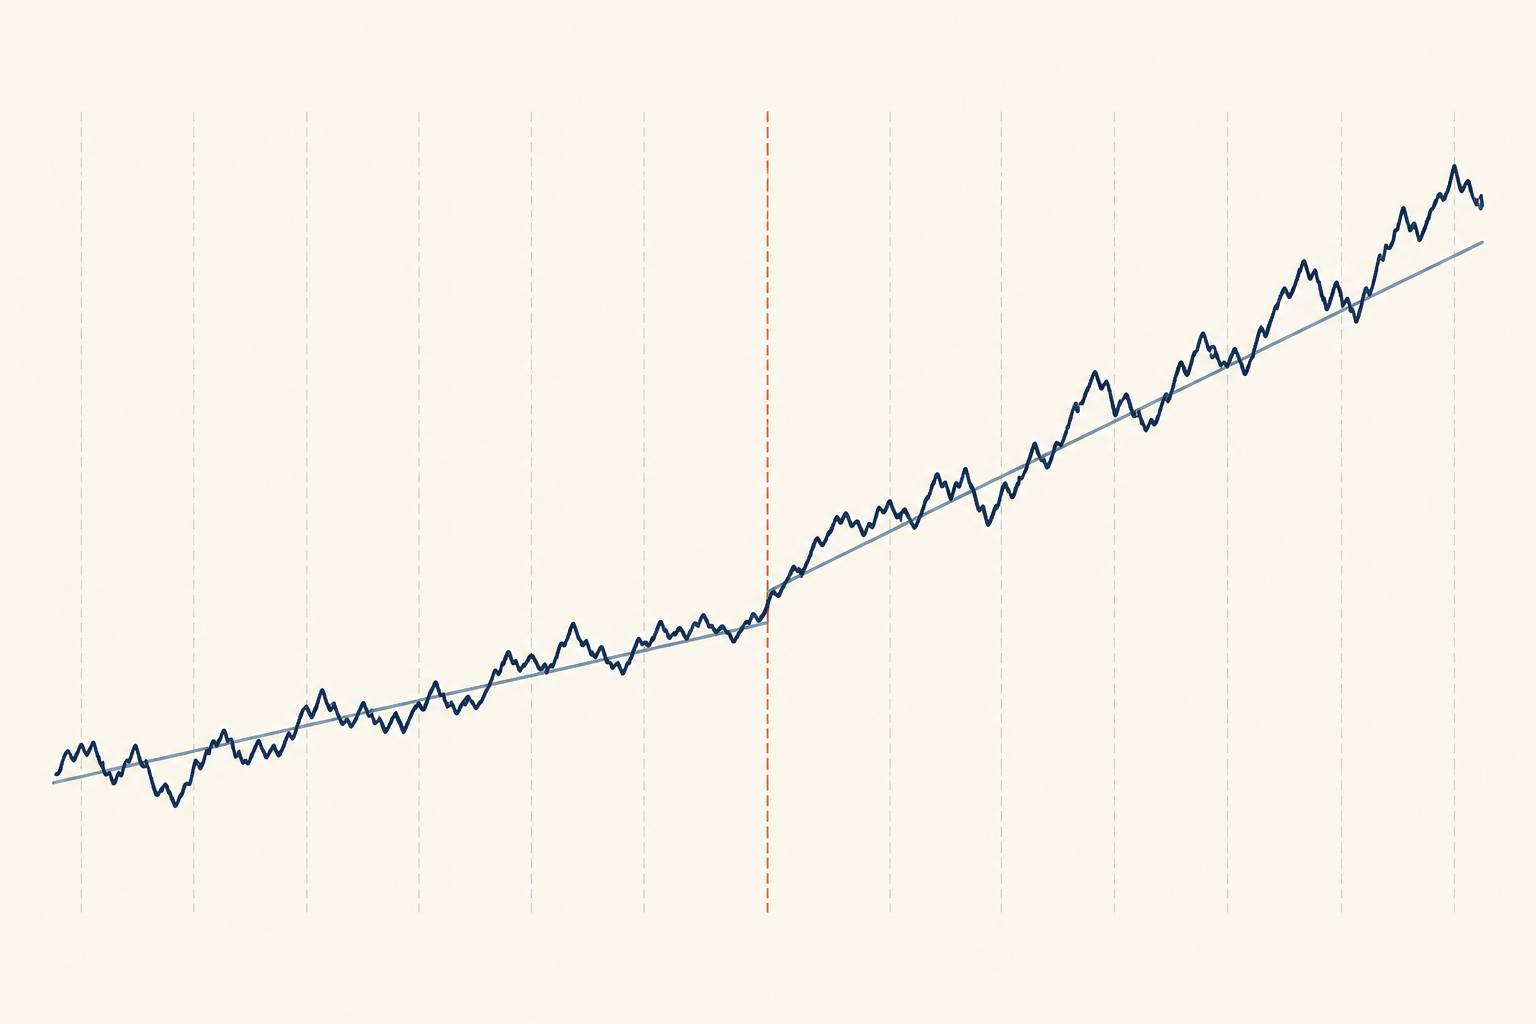
An augmented Dickey–Fuller test can have difficulty distinguishing a unit root from a stationary process when the series has a level or trend break that the regression omits. A one-time shift after a policy change, a change in a measured trend, or an exceptional market event can make the full sample look more persistent than either segment around its own deterministic path.
The ZA test adapts the Dickey–Fuller idea to one unknown break date. It asks whether the evidence against a unit root becomes stronger when the deterministic part of the regression is allowed to change once. The method is useful when a single break is a defensible feature of the question; it is not a general search for every kind of regime change.
This is still a unit-root test. It does not test whether a particular event caused a break, estimate a trading rule, or establish that prices will revert quickly enough to trade. The ADF and Phillips–Perron comparison covers the no-break baseline, while the stationarity and unit-root guide explains the broader hypotheses.
The null and alternative make the break assumption visible
A common differenced form of the candidate-date regression is
Δyₜ = dₜ(λ)′δ + αyₜ₋₁ + Σⱼ₌₁ᵖ φⱼΔyₜ₋ⱼ + εₜ
Here, λ is the candidate break fraction, dₜ(λ) contains the deterministic terms and candidate break terms for the chosen model, and the lagged differences account for short-run dependence. In this parameterization, a unit root corresponds to H₀: α = 0, which is equivalent to a level autoregressive coefficient of one.
The classic ZA setup tests a unit-root null with no deterministic trend break against an alternative in which the series is stationary around a trend that can have one break. Candidate break terms appear in the regressions so the alternative can represent that path, while the classic null calibration treats their break effect as absent. This distinction matters when interpreting the result and its critical values.
If the test does not reject, it has not proved that the series is an exact random walk. Low power, a short sample, an incorrectly chosen trend form, or a break under the null may all leave the test unable to reject. A rejection is evidence against the specified unit-root null, not proof that every shock is temporary in every market regime.
The statistic scans candidate dates and keeps the minimum
The analyst first defines an interior set of admissible break dates. Dates very close to either endpoint are commonly trimmed so the regressions have information on both sides of the candidate break. For every admissible λ, the regression is fitted and the t-statistic for α is recorded.
The selected date is the candidate with the smallest, most negative statistic:
λ̂ = arg min₍λ ∈ Λ₎ tα(λ) τZA = min₍λ ∈ Λ₎ tα(λ)
The test statistic is therefore the minimum over a search, not a t-statistic from a date specified in advance. The selected break fraction is conditional on the sample, model variant, lag specification, and trimmed candidate set. It is not automatically a precise estimate of the historical event date.
Lag choices affect the regressions too. Too few lagged differences may leave serial dependence in the residuals; too many can consume information, particularly in short samples. Report the lag rule and candidate-date trimming instead of treating the software defaults as part of the theory.
Three deterministic models represent different breaks
The traditional ZA variants are often described as models A, B, and C. Names vary across software, so check what a particular implementation means by “intercept,” “trend,” or “both.”
- Model A allows a one-time shift in the intercept, or level.
- Model B allows the slope of the deterministic trend to change.
- Model C allows both an intercept shift and a trend-slope change.
The choice is substantive. A permanent jump in an exchange-rate level suggests a different deterministic path from a gradual change in growth. A model that includes an unsupported trend change can spend power estimating unnecessary terms; omitting a plausible change can leave the regression misspecified. Define the kind of change that makes sense before comparing test outcomes.
These variants do not identify the economic cause of a change. The estimated date can reflect the best-fitting date in the sample under the chosen model, even when several events, measurement changes, or omitted dynamics could explain the shape.
A small example shows why the minimum matters
Suppose a researcher evaluates five hypothetical candidate dates. The table shows the t-statistic on the lagged level term from each candidate regression:
| Candidate break fraction λ | t-statistic for α |
|---|---|
| 0.20 | −2.1 |
| 0.35 | −2.8 |
| 0.50 | −4.0 |
| 0.65 | −3.0 |
| 0.80 | −2.2 |
The minimum is −4.0, so this search selects λ = 0.50. This only illustrates how the date and statistic are selected. The values are invented, and the example does not supply a ZA critical value or a rejection decision. In actual work, the candidate set, model, lag rule, and critical values must be defined together.
<!-- learn:illustration -->
The searched statistic needs matching critical values
Ordinary Dickey–Fuller or Student t critical values are not valid for the minimum statistic. Even if each candidate-date regression resembles an augmented Dickey–Fuller regression, searching many dates and retaining the most negative statistic changes the null distribution.
The appropriate reference values depend on the ZA model variant and the search design. Compare τZA with critical values derived for the same break specification and date search. Do not use the value at the selected date as though that date had been fixed before observing the sample, and do not compare the statistic with an ordinary ADF table.
The original Zivot and Andrews analysis develops this estimated-break procedure from Perron’s earlier tests with a specified break date. It treats the break location as unknown and determines the distribution for the search. For the historical development and implementation details, see the original paper and Perron’s known-break analysis.
Choose the financial series before choosing the break model
The result depends on what is being tested. A log price, an interest rate, a price spread, realized volatility, and a return series answer different questions. A long-run trend break can matter for a level but may be irrelevant to a short-horizon return. A spread used in pairs research needs its own economic and cointegration rationale.
For a technical-trading study, a ZA rejection can be one piece of evidence that the tested level is better represented by a broken deterministic trend than by the specified unit-root null. It does not show that the series is predictably mean-reverting after the estimated date, nor does it supply entry, exit, or risk rules.
The selected break uses the full sample that was searched. If the same full-sample date or test result is used to design and evaluate a strategy, later observations have influenced the choice. A trading analysis therefore needs a real-time or rolling design, out-of-sample evaluation, and realistic transaction costs; the test itself provides none of those protections.
A break under the unit-root null is an important limitation
The classic ZA critical values assume no break in the deterministic trend under the unit-root null. Later research shows that minimum Dickey–Fuller t-statistic procedures can over-reject when a trend break is actually present under that null; in the cases studied, the asymptotic size can become extremely large. A rejection may then reflect a mismatch between the null model and the data rather than evidence of trend stationarity. See Harvey, Leybourne, and Taylor’s analysis of infimum Dickey–Fuller tests.
The one-break alternative also cannot represent two or more changes, a temporary pulse, changing volatility, or a break that evolves gradually. Choosing among A, B, and C after looking for the smallest p-value adds another layer of selection. If several breaks or a break under the null are plausible, use a procedure designed for that hypothesis and its calibration rather than stretching the classic ZA test.
The Quandt–Andrews guide studies unknown break dates in regression parameters; the Bai–Perron guide covers multiple regression breaks. Those methods address related but distinct hypotheses and do not substitute for a break-aware unit-root test.
Report the search and the assumptions with the result
A useful report names the series and transformation, sample period and frequency, deterministic model, lag rule, trimming range, selected break fraction, minimum statistic, and matching critical value or p-value. State the null explicitly and say whether it permits a break. If the result changes across defensible model variants or lag choices, show that sensitivity.
Use the estimated date as a diagnostic, not a causal conclusion. Compare it with known institutional and market events, but avoid presenting a date selected from the same data as independent confirmation of one event. Keep the economic explanation, statistical rejection, and trading implication as separate claims.
For a broader unit-root workflow, compare the stationarity guide, then use ADF or PP as complementary no-break diagnostics where appropriate. When a long-run relationship between nonstationary variables is the question, consult the Engle–Granger cointegration guide. No single test determines the right transformation or establishes a profitable strategy.
Common questions
Q1Does the Zivot–Andrews test find the true event date?
It finds the candidate date that produces the smallest test statistic within the chosen search and model. That date is conditional on the sample, trimming, lag rule, and break specification; it is not by itself a causal estimate or a confidence interval for the event date.
Q2Is the Zivot–Andrews test just an ADF test with a dummy?
It uses augmented Dickey–Fuller-style regressions with break terms, but it searches over candidate dates and reports a minimum statistic. That search changes the reference distribution, so ordinary ADF critical values cannot be reused.
Q3What is the difference between models A, B, and C?
Model A allows an intercept or level shift, model B allows a change in deterministic trend slope, and model C allows both. Software labels can differ, so check the implementation’s definition before interpreting output.
Q4Can I use a ZA rejection as a trading signal?
No. Rejection is evidence against a specified unit-root null under a particular break model. It does not establish future predictability, a profitable entry rule, or performance after transaction costs. Primary research - Zivot and Andrews, “Further Evidence on the Great Crash, the Oil-Price Shock, and the Unit-Root Hypothesis” (1992) - Perron, “The Great Crash, the Oil Price Shock, and the Unit Root Hypothesis” (1989) - Harvey, Leybourne, and Taylor, “On Infimum Dickey–Fuller Unit Root Tests Allowing for a Trend Break under the Null” (2014) - Dickey and Fuller, “Distribution of the Estimators for Autoregressive Time Series with a Unit Root” (1979)
Sources and further reading
Report an issue
We’ll prepare an email with this article link. Mark receives the report only after you send it
Quick check
Read the guide? Check yourself with 3 questions
Question 01
How does the classic ZA test select its reported statistic?
Choose an answer to see the explanation
Options glossary
Clear definitions of essential option terms, from calls, puts, and option chains to IV, Greeks, open interest, and max pain
Browse the options glossary