

Bai–Perron Tests for Multiple Structural Breaks in Regression
Learn how Bai–Perron methods search for an unknown number and dates of regression breaks, how trimming and critical values work, and what break estimates cannot establish.
In this guideWhat a multiple-break regression test asks
Short summary
Bai–Perron methods estimate regression break dates jointly for a chosen number of breaks, then use tests or model-selection rules to assess how many breaks the data support. The dates and break count depend on the regression, minimum segment length, error assumptions, and search procedure; they do not identify a cause or a trading edge.
What a multiple-break regression test asks
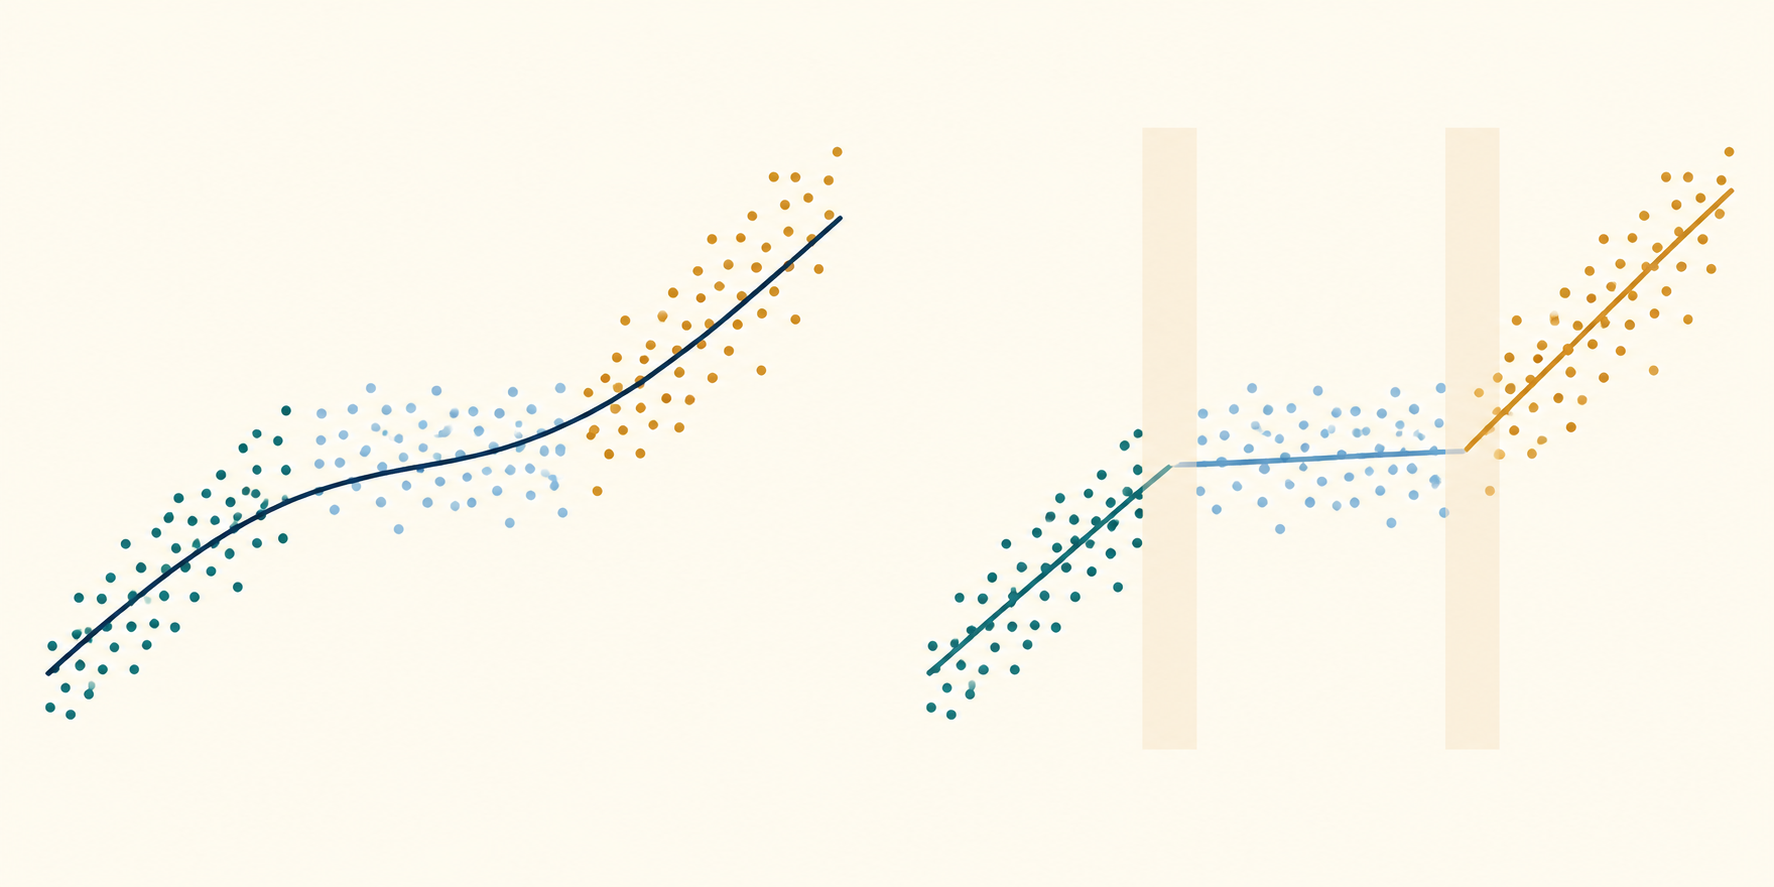
A structural break in a regression means that one or more coefficients may have changed at an unknown point in the sample. A single full-sample estimate can hide this: if a return–risk relationship is positive in one interval and weaker or reversed later, its average coefficient may describe neither interval well. Bai–Perron procedures turn that concern into a defined search over partitions of the observations.
The key distinction from the Chow test is whether the date was fixed in advance. A Chow test compares specified subsamples around a supplied date; trying many dates and reporting the largest ordinary Chow statistic does not preserve that test's usual reference distribution. Bai–Perron tests account for searching candidate dates and can assess more than one break. See the Chow test guide for the prespecified-date case.
The distinction from regression CUSUM is also important. CUSUM examines an ordered path of recursive residuals for evidence against stability, but does not by itself return a selected set of multiple break dates. Bai–Perron instead estimates a partition under an explicit piecewise-regression model. Neither method explains why a relationship changed. For the residual-path diagnostic, see the regression CUSUM guide.
Write the regression with unknown dates and an unknown break count
Suppose there are \(T\) observations and \(m\) breaks at integer dates \(T_1<\cdots<T_m\). Set \(T_0=0\) and \(T_{m+1}=T\), and define segment \(j\) as observations \(T_{j-1}+1,\ldots,T_j\). In a pure structural-change model,
\[ y_t=x_t'\beta_j+u_t,\qquad T_{j-1}<t\le T_j,\quad j=1,\ldots,m+1. \]
Here \(y_t\) is the outcome, \(x_t\) is a vector of included regressors, \(\beta_j\) is the coefficient vector in segment \(j\), and \(u_t\) is the error. The unknowns are not just the coefficient values: unless fixed by design, both the break dates and the number \(m\) must be estimated or selected. The model also assumes that observations are ordered meaningfully and that a segment has a stable coefficient vector under the chosen specification.
For a financial example, \(y_t\) might be a portfolio return and \(x_t\) could include a market return, rate change, or volatility measure. A detected break says that the selected piecewise-linear conditional mean fits better in-sample under the procedure. It does not imply that a named event changed the coefficient, that the variable is exogenous, or that the relationship is stable out of sample.
It is useful to distinguish an observation date from a calendar date. If observations are daily trading sessions, a break between session numbers 120 and 121 need not correspond to one calendar day of market behavior; holidays, missing quotes, and irregular sampling affect the mapping. State how the sample was ordered and how the break date is reported before treating it as an event timestamp.
Choose pure or partial structural change deliberately
In a pure structural-change model, every coefficient in \(\beta_j\) can vary between segments. This allows the intercept and all slopes to change, but it uses more segment-specific parameters. A break may therefore be harder to estimate precisely when segments are short or the regressor vector is large. Pure change is appropriate only when the question permits every modeled relationship to reset.
In a partial structural-change model, some coefficients are constrained to remain common while others may change. For example, write \(\beta_j=(\delta',\gamma_j')'\), where \(\delta\) is shared across segments and \(\gamma_j\) is segment-specific. This can reflect a substantive restriction, such as allowing the intercept and a policy-exposure slope to shift while keeping a control effect common. The restriction changes both the fitted objective and the test's reference distribution; it should be stated rather than treated as a harmless simplification.
The computation also differs. With pure change, a candidate partition's residual sum of squares (RSS) is the sum of independent segment RSS values, so a dynamic-programming recurrence can optimize the partition for a fixed break count. In a partial model, the common coefficients link all segments. Bai and Perron describe an iterative procedure that alternates between estimating break dates and changing coefficients with the common coefficients held fixed, then updating the common coefficients for a given partition. The simple additive segment-RSS recurrence alone does not jointly solve that restricted model. The chosen specification should follow the scientific or forecasting question, not whichever version reports more breaks.
Set a minimum segment length before looking at candidate dates
Break searches need a minimum number of observations in each segment. This trimming rule avoids fitting extremely short intervals that can produce unstable coefficients, but it also rules out genuine changes that occur too close to a sample endpoint or to another break. The rule is part of the design, not a universal law of nature.
Consider a clearly hypothetical sample with \(T=240\) observations and a chosen trimming fraction of 15%. This gives \(h=0.15\times240=36\) observations as the minimum segment length. For one break, when a break date marks the last observation of the earlier segment, the admissible dates are \(36\le T_1\le204\). Both sides then contain at least 36 observations.
For two breaks, the admissible date pairs must satisfy
\[ 36\le T_1,\qquad T_1+36\le T_2\le204. \]
Equivalently, \(T_1\le168\), while \(T_2\) must leave 36 observations after the second break and remain at least 36 observations after the first. The pair \((72,156)\) is admissible: its three segments have 72, 84, and 84 observations. The pair \((80,100)\) is not, because the middle segment contains only 20 observations. With this \(h\), no more than five breaks can fit in 240 observations, since six segments require at least \(6\times36=216\) observations while seven require \(7\times36=252\).
The 15% figure here is an explicit hypothetical design choice, not a default recommendation. A larger fraction can exclude short-lived regimes and dates near the sample boundaries; a smaller fraction admits short segments but may leave too little information to estimate slopes and long-run covariance quantities reliably. Choose the rule based on the sampling frequency, number of regressors, plausible regime duration, and inference method. Report it and, when substantively reasonable, show whether conclusions change under nearby trimming choices. Implementations can define effective sample size and endpoints differently when lags or missing observations are involved, so document the actual convention used.
Use dynamic programming to find a global segmentation for a fixed count
For a pure-change model and a fixed \(m\), the date search can be expressed as minimizing total segment RSS:
\[ \min_{T_1,\ldots,T_m}\;\sum_{j=1}^{m+1}\operatorname{SSR}\(T_{j-1}+1,T_j\), \]
subject to the ordering of dates and a minimum segment length. Here \(\operatorname{SSR}(a,b)\) is the least-squares residual sum of squares from fitting one segment over observations \(a,\ldots,b\). A naive search checks every date combination, whose count grows quickly with \(T\) and \(m\).
Dynamic programming reuses optimal subproblems. If \(D(r,j)\) is the smallest RSS for partitioning observations 1 through \(j\) into \(r\) valid segments, one form of the recurrence is
\[ D(r,j)=\min_{i}\{D(r-1,i)+\operatorname{SSR}(i+1,j)\}, \]
where the minimizing split \(i\) is restricted so each of the first \(r-1\) segments and the final segment meet the minimum length. Keeping the minimizing split at each step permits recovery of the dates. For each allowed number of segments, the algorithm obtains a globally minimum-RSS partition under the specified model and constraints, rather than adding breaks greedily one at a time. Bai and Perron (2003) develop the computation and discuss both pure and partial change models.
“Global” here is conditional on the chosen count, regressors, deterministic terms, trimming, and objective. It does not mean that the statistical model is true, that this count is correct, or that the fitted partition is globally optimal across every possible specification. The procedure may efficiently compare several counts, but selection of \(m\) is a separate inference or model-selection step.
Select the number of breaks with search-adjusted inference or criteria
Once best partitions have been computed for candidate counts, several approaches can guide the choice of \(m\). A sequential \(\sup F(\ell+1\mid\ell)\) test compares a model with \(\ell\) breaks with one additional break, using a supremum statistic over admissible dates. Double-maximum tests such as UDmax or WDmax test no breaks against an alternative with an unknown number of breaks up to a stated maximum. Information criteria, including BIC-type criteria, compare fit improvements with a complexity penalty. These methods answer related but not identical questions.
The ordinary F critical value is generally not appropriate after maximizing over unknown break dates. Under the no-break null, the candidate dates are not identified in the same way as under the alternative, which produces nonstandard limiting distributions. Critical values depend on features such as trimming, pure versus partial change, regressors, and assumptions about the error covariance. Bai and Perron (1998) derive tests for multiple changes; their later critical-values study tabulates values for different trimming and model settings. Andrews (1993) provides important unknown-change-point results for one-break instability tests, but its critical values are not a substitute for a multiple-break procedure.
Sequential tests are interpretable but their outcome can depend on power at each step and the prespecified maximum number of breaks. Information criteria can select different counts because their penalties differ and because the candidate models may all be approximations. More breaks do not automatically mean a more realistic account: a small fit gain may come at the cost of unstable segment coefficients. Report the method, maximum count, trimming, test sequence or criterion, and matching critical-value assumptions. If a choice is consequential, show sensitivity rather than presenting one selected count as certain.
Treat estimated dates as uncertain conditional estimates
The minimizing dates are point estimates under a specified model. They should not be reported as if the data revealed an exact instant when an economic relationship changed. Sampling variation, a small coefficient shift, nearby breaks, noisy outcomes, regressors with little variation, and a long minimum segment can all make the objective relatively flat around its minimum. Several nearby partitions may fit almost equally well.
Bai and Perron develop confidence intervals for break dates under stated conditions. Those intervals describe sampling uncertainty for the modeled break dates; they do not capture every uncertainty about whether the regression is correctly specified, which variables should be included, the number of breaks, or the trimming rule. If the number of breaks itself is uncertain, a narrow date interval conditional on one chosen count can understate the overall uncertainty.
Practical reporting should distinguish the date convention, estimated observation index, translated calendar date, and interval for each break. If intervals overlap or are wide, describe the evidence as weakly localized. Do not choose a date from a chart after seeing the result and then describe it as an independently predicted event. When comparing estimated breaks with a known event, account for the fact that the event and window may have been selected after viewing the data.
Match inference to serial dependence and changing variance
The RSS partition is a fit criterion; the validity of tests and confidence intervals depends on assumptions about the regressors and errors. Financial regressions often have serial correlation, conditional heteroskedasticity, outliers, changing volatility, overlapping returns, or asynchronous observations. If the covariance estimator and critical values assume independent, equal-variance errors while the residuals are dependent or heteroskedastic, the reported significance can be misleading even when the fitted break dates look plausible.
Bai–Perron work develops procedures under broader conditions, including forms of heteroskedasticity and serial dependence, but the analyst must use the covariance correction and reference values appropriate to the actual setup. A robust or HAC covariance estimate cannot repair omitted dynamics, an endogenous regressor, an incorrect conditional mean, or an observation calendar that combines incompatible intervals. Nor does using a robust standard error by itself change the RSS objective into a better model of the data.
Check residual dependence and variance patterns within and across candidate segments. State whether the error assumptions permit segment-specific variances, serial correlation, or changing regressor distributions, and whether the selected test's theory covers them. Very short segments make robust covariance estimation especially fragile, which is another reason trimming and model dimension must be planned together. For background on regression estimates and covariance assumptions, see the OLS regression guide.
Report the break analysis without turning it into a causal or trading claim
A reproducible report names the outcome, all regressors, transformations, sample interval and frequency, intercept and coefficient restrictions, pure or partial change specification, candidate maximum \(m\), trimming fraction and minimum length, date convention, optimization method, and the test or criterion used to select \(m\). Include the selected break count, coefficients by segment, dates and uncertainty intervals, test statistics, covariance treatment, and critical-value source. Explain any endpoints or observations excluded from the search.
A statistically detected break establishes evidence of parameter instability in the specified regression under its assumptions. It does not establish which event caused the change, prove that a particular news release or policy shift is responsible, or show that the pre- and post-break coefficients will persist. A break may reflect an omitted variable, a changed data definition, a volatility episode, a measurement problem, or a genuine economic shift; the regression test alone does not distinguish these explanations.
For quant trading, a full-sample search uses observations from both sides of each estimated break. Trading as if the selected date had been known in real time introduces look-ahead bias. Evaluate any proposed regime rule chronologically, re-estimate only with information available at each date, and include spread, fees, market impact, financing, borrow, turnover, and latency. Compare with simple fixed-parameter and no-trade baselines, and reserve genuinely later data for validation. A break can motivate a model review or risk investigation; it is not evidence of predictive power or an investable edge.
Bai and Perron (1998) present tests and estimation for multiple structural changes in linear models in their original paper. Their 2003 computation paper explains the dynamic-programming and partial-change procedures, and their critical-values paper details how test values vary with the design. Andrews's unknown-change-point paper provides a related one-break foundation. For adjacent diagnostics, compare the prespecified Chow test with the regression CUSUM test.
Common questions
Q1Does Bai–Perron tell me the true number of breaks?
No. The method estimates partitions and provides tests or criteria for choosing among candidate counts. The result depends on the regression specification, trimming, error assumptions, maximum count, and selection rule; it is not certainty that the data-generating process had exactly that many breaks.
Q2Is a break date the date an economic event caused the change?
No. It is an estimated location of parameter instability under a fitted model, with sampling uncertainty. Connecting it to a cause requires additional evidence and a design that rules out competing explanations.
Q3Can I trade directly on the estimated break dates?
Not from a retrospective full-sample estimate alone. The date search uses data from the full sample, including observations after a candidate break. A live rule needs chronological evaluation, information available at the time, costs, and later validation; a detected break does not establish a profitable signal.
Sources and further reading
Report an issue
We’ll prepare an email with this article link. Mark receives the report only after you send it
Quick check
Read the guide? Check yourself with 3 questions
Question 01
In a 240-observation example, what does a 15% minimum-segment rule imply?
Choose an answer to see the explanation
Options glossary
A relationship describing how an outcome would differ under a specified intervention or counterfactual change; observed association alone does not identify it.
Read the deeper guideMulticollinearityStrong linear dependence among included regressors that makes their separate coefficients imprecise and sensitive to the sample.
Read the deeper guide