

Quandt–Andrews Test: Sup-Wald for an Unknown Break Date
Learn how the Quandt–Andrews sup-Wald test searches for one unknown regression break, why trimming matters, and why its null distribution is not an ordinary F distribution
In this guideAn unknown break date changes the question
Short summary
The Quandt–Andrews approach tests whether a regression’s coefficients stay constant when one break date is unknown. It calculates a break statistic at each admissible date and takes the largest one. Because the date is selected by a search and is not identified when the no-break null is true, the maximum does not follow the ordinary fixed-date F distribution.
An unknown break date changes the question
A Chow test answers a focused question: did the regression coefficients change at a date chosen before looking at the test results? In many financial or macroeconomic applications, the analyst does not have one defensible date in advance. Trying a list of dates and reporting the most significant Chow result turns the date choice into part of the test. The usual single-date critical values then ignore that search.
Quandt’s two-regime procedure and Andrews’s later asymptotic framework address this problem by evaluating a statistic over a set of candidate break dates. In applied linear regression, the resulting maximum is commonly called a Quandt likelihood-ratio (QLR), sup-F, or sup-Wald statistic, depending on the exact statistic and covariance treatment. Andrews develops sup-Wald, LM, and LR-like tests for broader parametric settings with an unknown change point (Quandt, 1960; Andrews, 1993).
The target here is deliberately narrow: test one possible change in a specified regression relationship while its date is unknown. The test does not estimate an unknown number of changes, explain what caused a change, or identify a trading opportunity. The [Bai–Perron guide](/en/learn/bai-perron-multiple-structural-breaks-regression-tests-explained) covers the distinct problem of modeling multiple unknown break dates.
Specify the one-break regression and its restrictions
Let the ordered sample contain observations (t=1,ldots,T), with outcome (y_t) and regressor vector (x_t). A pure one-break model is
yₜ = xₜ′β₁ + uₜ, t ≤ k yₜ = xₜ′β₂ + uₜ, t > k
where (k) is the last observation in the first regime. Under the no-break null, the tested coefficient vectors are equal, (H₀: β₁ = β₂). The one-break alternative says they differ for at least one admissible date. A partial-change model may restrict only a predeclared subset of coefficients to change; that changes the number of restrictions and the test’s reference distribution. State which coefficients are allowed to move.
The model needs an ordering that makes a break date meaningful. For daily returns, (k) is usually a trading-session index, not automatically a calendar day. Missing observations, holidays, asynchronous markets, contract rolls, and changes in the target definition can alter what “before” and “after” mean. Define the sample and the date convention before interpreting the selected split as an event.
A rejection is evidence against the specified constant-coefficient model in favor of some one-break alternative within the searched range. It is not a test that the break was caused by a named announcement, that regressors are exogenous, or that the post-break coefficients will persist. If the conditional mean, error dynamics, or measurement process is wrong, the test may respond to that misspecification instead of a clean parameter shift.
Trim candidate dates and fit both sides of each split
A candidate date near either sample endpoint leaves too few observations to estimate one side reliably. A trimming fraction ( arepsilon) excludes those endpoints and searches only over break fractions (lambda=k/T) in a prespecified interval such as ([ arepsilon,1- arepsilon]). In a discrete sample, implementations translate that interval into integer dates and enforce the required observations and full-rank regressors in both segments. Report the exact convention, including whether (k) denotes the last pre-break or first post-break observation.
At each admissible (k), fit the pooled null model and the corresponding two-regime model, then compute a statistic for the restrictions on the coefficient change. In the classical OLS case with independent, homoskedastic errors and a common regressor set, this can be expressed using the reduction in residual sum of squares. Under normal errors, a statistic for one prespecified date has an exact finite-sample F reference distribution; without normality, that exact finite-sample claim does not follow. A Wald version instead evaluates the estimated coefficient difference relative to its estimated covariance. With heteroskedasticity or serial dependence, a robust covariance and a matching reference method are needed; changing the standard error alone does not make an ordinary F critical value valid after the date search.
Trimming is part of the test design, not a cosmetic setting. More trimming shortens the search and avoids very small regimes, but it rules out larger endpoint-adjacent breaks. Less trimming admits those candidates while making asymptotic approximations and finite-sample estimates more fragile. Choose the range for the sample size, model dimension, and substantive question before inspecting where the statistic peaks.
<!-- learn:illustration -->
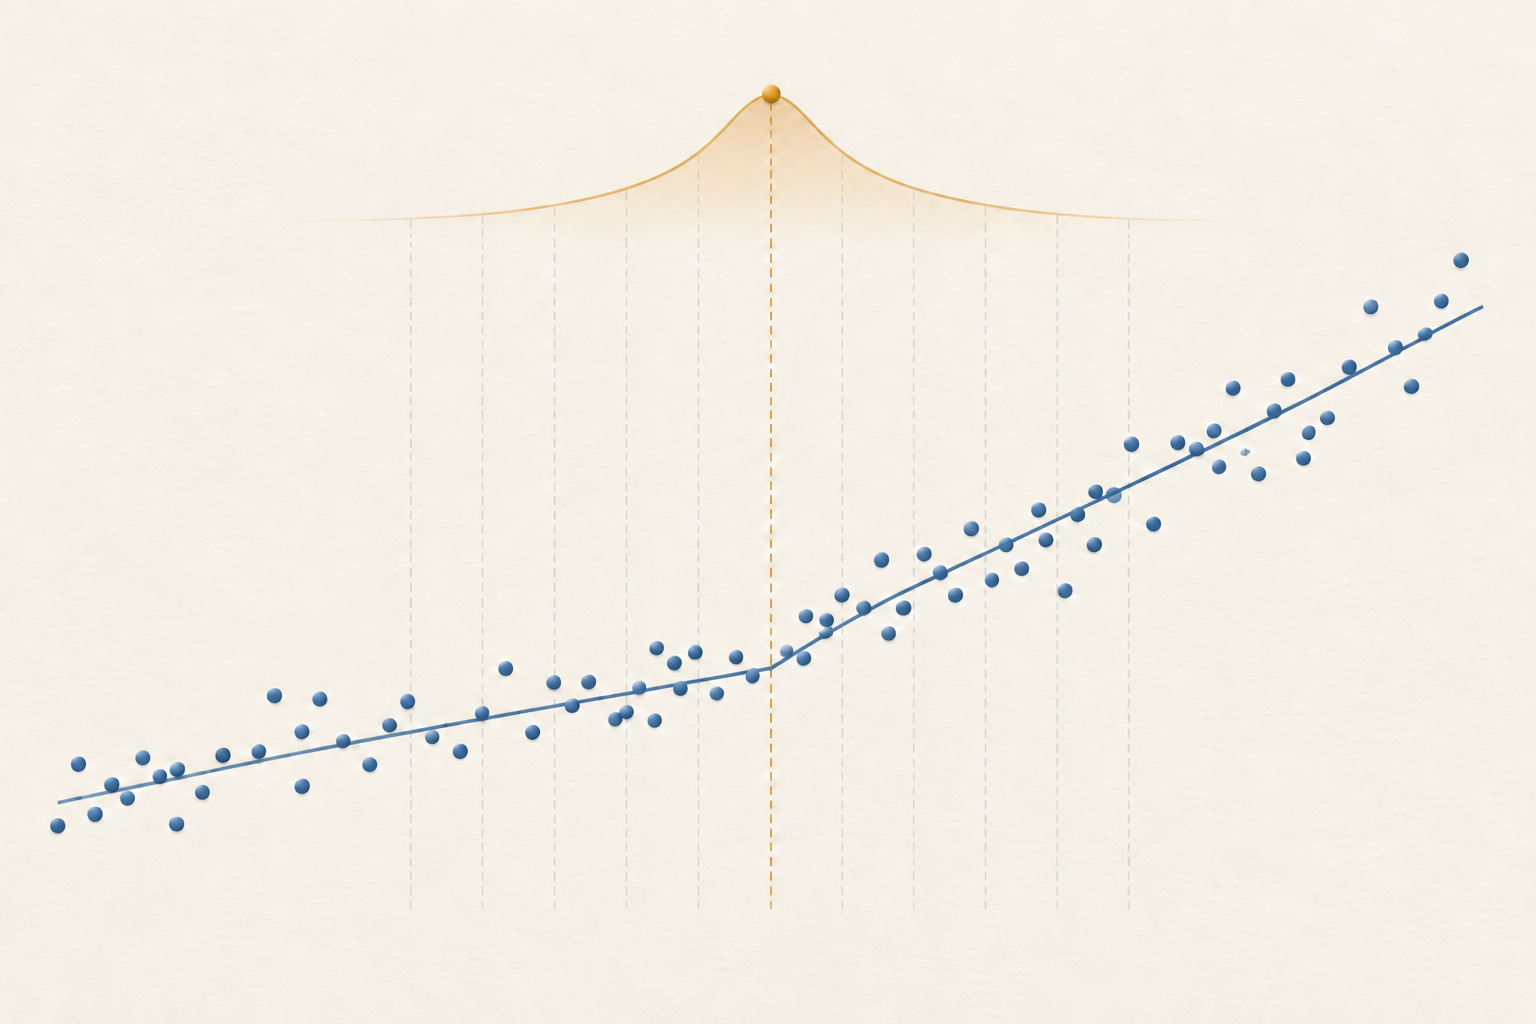
The sup-Wald statistic is the largest candidate-date statistic
For each candidate date (k), let (W(k)) be a Wald statistic for the specified coefficient restrictions. The one-break sup-Wald statistic is
supW = max{k ∈ K} W(k)
where (K) is the trimmed set of admissible dates. In the classical linear-regression implementation, the candidate-date Chow F statistics are often maximized and reported as a sup-F or QLR statistic. The maximizer (hat{k}=argmax_{kin K} W(k)) is the date that produces the largest statistic in this search. It is a selected estimate, not a confidence interval or a precise timestamp for the economic change.
These labels are related but not universally interchangeable. A conventional homoskedastic Chow F at a fixed date has an exact finite-sample F reference distribution under its assumptions. The maximum over dates, an asymptotic sup-Wald statistic with a robust covariance, and a likelihood-ratio statistic need not have identical finite-sample values or identical critical values. Report the statistic actually computed, the covariance estimator, the trimming rule, and the critical-value source rather than relying on “QLR” alone.
The candidate statistics are strongly dependent because neighboring splits reuse almost all the same observations. The test is not equivalent to taking the smallest fixed-date p-value, multiplying it by the number of dates, or treating each date as an independent test. The search-aware null distribution is derived for the maximum process.
The searched maximum has a nonstandard null distribution
Under the no-break null, there is no true break date to estimate. The date parameter is present under the alternative but disappears under the null, so ordinary regularity arguments for one prespecified Wald or F test do not apply. Maximizing over candidate dates therefore produces a nonstandard asymptotic distribution. Comparing the maximum with a standard F cutoff generally overstates evidence against stability.
Andrews derives asymptotic distributions and critical values for sup-Wald, LM, and LR-like tests, with the searched interval summarized by its trimming endpoints and the number of tested restrictions (1993). The applicable values also depend on the model and covariance assumptions. Use the table, implementation, or approximation that matches the specific test; do not borrow a critical value from a different trimming fraction or restriction count. Andrews later published a corrigendum because some reported sup-test critical values for eight restrictions were too small, so that case requires the corrected table (2003 corrigendum). Hansen provides numerical approximations for asymptotic p-values of structural-change tests (1997).
Andrews and Ploberger also derive average and exponential tests for nuisance parameters present only under the alternative (1994). Those are related search-aware procedures, not alternate names for sup-Wald. If using a bootstrap or another finite-sample calibration, describe the resampling design and show that it reproduces the null structure and the same search; a generic bootstrap does not automatically solve date selection or dependence.
A twelve-observation example makes trimming and the maximum checkable
Consider an intentionally small, hypothetical intercept-only regression with observations
y = [0, 1, 1, 1, 1, 1, 3, 3, 3, 3, 3, 3]
There are (T=12) observations. Set ( arepsilon=0.25) for illustration, so each segment must contain at least three observations and the candidate last-pre-break dates are (k=3,ldots,9). This is an example of the search arithmetic, not a recommended trimming choice or an inferential sample.
The pooled mean is (23/12), and the pooled residual sum of squares is
RSS₀ = Σ yₜ² − (Σ yₜ)²/12 = 59 − 529/12 = 179/12
At the candidate (k=6), the first segment has sum 5 and sum of squares 5, so its residual sum of squares is (5−5²/6=5/6). The second segment contains six values of 3, so its residual sum is zero. Thus (RSS₁(6)=5/6). With one restriction and two estimated segment intercepts, the fixed-date statistic is
F(6) = [(RSS₀ − RSS₁(6))/1] / [RSS₁(6)/(12−2)] = 169
Applying the same calculation to all seven candidates gives approximate F values (7.21, 12.10, 25.28, 169.00, 20.71, 8.94, 4.59) for (k=3,ldots,9), respectively. The sup-F is their maximum, 169, at (k=6). The calculation verifies which candidate maximizes this constructed sequence; it does not provide a p-value. Because the date was searched, 169 must be compared with the search-aware nonstandard critical value for a matching design, not the ordinary fixed-date F distribution.
Interpret rejection and non-rejection within the design
A rejection says the constant-coefficient null is inconsistent with the largest statistic found over the admissible range at the selected significance level, given the test assumptions and critical values. It does not establish a unique, precisely timed break. Nearby candidate dates can have similar statistics, and the apparent peak can move when the sample endpoint, trimming, regressors, or covariance method changes. Report the profile of candidate statistics or a suitable date-uncertainty analysis rather than presenting (hat{k}) as exact.
A non-rejection does not establish coefficient stability. The test may have low power against a small change, a change near a trimmed endpoint, or one that affects a coefficient not included in the tested restrictions. A single-break test can also miss a pattern with several changes that partly offset each other. Conversely, a rejection can reflect an outlier, changing variance, omitted dynamics, a data-definition change, or repeated specification search. The test answers a bounded statistical question, not the cause of a discrepancy.
The date estimate is selected using the same data as the test. Do not use it as if it were a prespecified event date for a second unadjusted significance test, then claim independent confirmation. If the date guides a forecast update or trading rule, specify that rule and evaluate it on later data; the in-sample sup statistic does not establish post-break persistence or economic value.
Distinguish Chow, CUSUM, and Bai–Perron questions
| Method | Main question | What it does not do |
|---|---|---|
| [Chow test](/en/learn/chow-test-structural-break-regression-finance-explained) | Do coefficients differ at a date fixed in advance? | Search over unknown dates while retaining the single-date reference distribution |
| [Quandt–Andrews sup test](#) | Is there evidence of one break at some date in a trimmed range? | Choose an unknown number of breaks or explain the cause |
| [Regression CUSUM](/en/learn/cusum-test-regression-stability-recursive-residuals-explained) | Does an ordered recursive-residual path conflict with coefficient stability? | Return a selected one-break date by itself |
| [Bai–Perron](/en/learn/bai-perron-multiple-structural-breaks-regression-tests-explained) | How many breaks and what dates are supported under a multiple-break model? | Replace the one-break test’s specification and selection choices |
A hidden Markov or regime-switching model asks a different question again: whether observations can be modeled with latent states that may change repeatedly according to transition probabilities. A single unknown-break test considers one persistent before/after split within its range. The methods can complement each other, but their assumptions and outputs are not interchangeable; see the [regime-switching guide](/en/learn/hidden-markov-model-regime-switching-finance-explained).
Report the search so another analyst can reproduce it
State the outcome and regressors, whether the model is a pure or partial change, the tested coefficient restrictions, sample dates and ordering, and the break-date convention. Report (T), the number of restrictions, the trimming fraction or exact candidate set, minimum segment size, and whether the selected statistic is sup-Wald, sup-F/QLR, sup-LM, or another procedure. Include the covariance estimator, critical-value or p-value method, and any finite-sample correction used.
Show the statistic across candidate dates and report the maximizing date as a selected location, with uncertainty or sensitivity information where available. Explain whether the model and test design were prespecified, how missing observations and real-time data were handled, and which alternative samples or regressors were examined. If the analysis is for forecasting, keep the break search inside the training sample and evaluate any revised model on later untouched data.
A statistically significant unknown-break test does not identify an event’s cause or prove a profitable regime. A non-significant result does not certify stability. The defensible conclusion is limited to the specified one-break alternative, trimmed date range, regression, sample, and search-aware inference method.
Common questions
Q1Is the Quandt–Andrews test just a Chow test repeated at many dates?
It computes a related statistic over candidate dates, but inference must account for taking the maximum. Reporting the largest ordinary Chow result with its fixed-date p-value ignores the search and generally uses the wrong null distribution.
Q2Does the maximizing date identify when an economic event caused a break?
No. It is the candidate date with the largest statistic in the chosen sample and trimmed range. It is not a causal timestamp or a confidence interval; nearby dates and design choices may produce similar results.
Q3Does a rejection mean there was exactly one break?
No. It rejects a specified constant-coefficient null in favor of some one-break alternative within the searched range. Several changes, outliers, variance shifts, or model misspecification can also produce instability evidence; estimating multiple breaks is a different task.
Q4Can I compare the sup-Wald maximum with an ordinary F table?
Not in general. Use critical values or p-values matching the sup statistic, trimming, restriction count, model, and covariance assumptions. The ordinary F distribution applies to the prespecified-date test under its assumptions, not automatically to the searched maximum. Primary research - Quandt, “Tests of the Hypothesis That a Linear Regression System Obeys Two Separate Regimes” (1960) - Andrews, “Tests for Parameter Instability and Structural Change with Unknown Change Point” (1993) - Andrews, “Tests for Parameter Instability and Structural Change with Unknown Change Point: A Corrigendum” (2003) - Hansen, “Approximate Asymptotic P Values for Structural-Change Tests” (1997) - Andrews and Ploberger, “Optimal Tests When a Nuisance Parameter Is Present Only Under the Alternative” (1994) - Chow, “Tests of Equality Between Sets of Coefficients in Two Linear Regressions” (1960) - Bai and Perron, “Estimating and Testing Linear Models with Multiple Structural Changes” (1998) - Brown, Durbin, and Evans, “Techniques for Testing the Constancy of Regression Relationships over Time” (1975)
Sources and further reading
Report an issue
We’ll prepare an email with this article link. Mark receives the report only after you send it
Quick check
Read the guide? Check yourself with 3 questions
Question 01
What does the Quandt–Andrews sup-Wald test do when the break date is unknown?
Choose an answer to see the explanation
Options glossary
A model generating observations from finite discrete latent states with Markov transition probabilities and state-dependent emissions.
Read the deeper guideAt the moneyA call or put whose strike is near the underlying price; it has little intrinsic value and often substantial sensitivity to time and volatility.
Read the deeper guide