

The ARCH LM Test: Detecting Volatility Clustering
Learn how the ARCH LM test checks squared financial-model residuals, how to calculate its statistic, choose lags, and interpret its limits.
In this guideWhat the ARCH LM test asks
Short summary
The ARCH LM test asks whether past squared residuals help explain current squared residuals after a mean model has been fitted. Its null is no ARCH dependence through a chosen number of lags. A rejection is evidence of conditional magnitude dependence under the test's assumptions; it does not reveal the cause, prove a GARCH model is right, or forecast return direction.
What the ARCH LM test asks
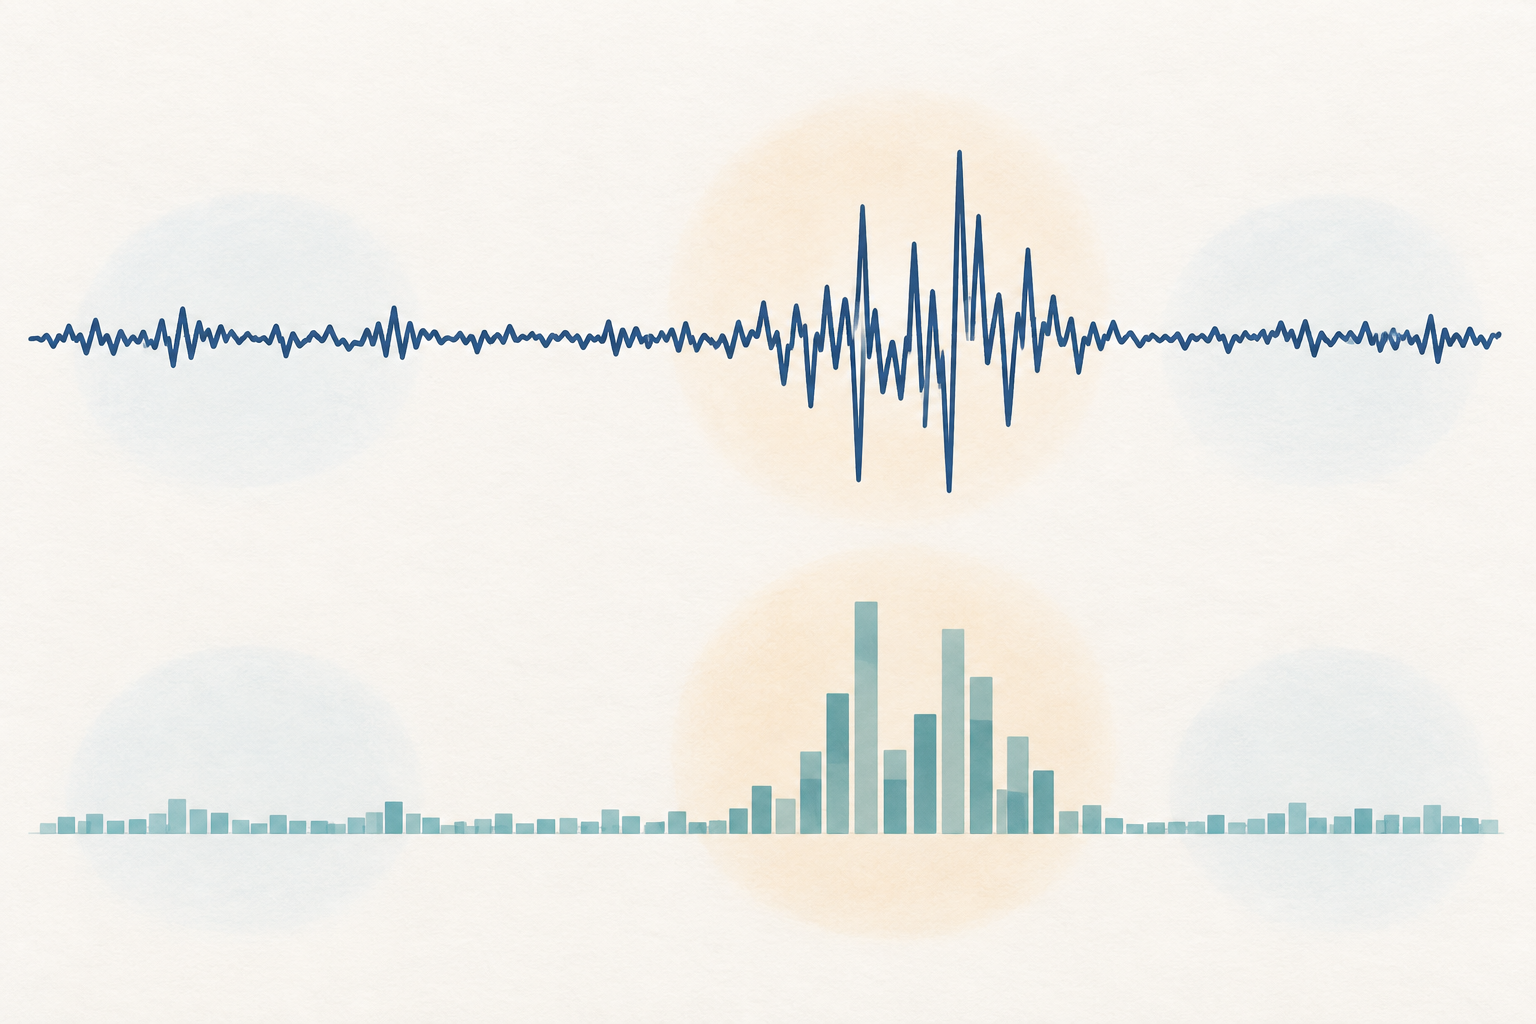
Financial returns can be hard to predict in direction while their sizes still arrive in clusters. A large move may be followed by a run of unusually large moves, and quiet periods may also persist. This pattern is called volatility clustering.
The ARCH LM test turns that observation into a diagnostic question: after accounting for the conditional mean, do recent squared innovations contain information about the current squared innovation? The test is associated with Robert Engle's ARCH framework, which models a time-varying conditional variance rather than a constant variance.
The null hypothesis is that the selected lagged squared residuals do not jointly explain current squared residuals. The alternative is consistent with ARCH effects at one or more of those lags. It is a test of a specified residual pattern, not a general certificate that a return series is predictable.
Start with residuals from a defensible mean model
First define the return series and the information that was available at each observation. Decide whether returns are simple or log returns, how dividends or funding are treated, and how missing sessions and overnight gaps are handled. Those choices change the residuals the test sees.
Then fit a reasonable mean equation for the research question, such as a constant-only model when the intended return innovations are demeaned, or a regression with prespecified factors. Save its residuals, written here as e_t. A misspecified mean can leave patterns in those residuals that look like variance dynamics.
Do not choose a mean model only because its ARCH test is insignificant. That makes the diagnostic part of an outcome-driven search. State the mean equation, estimation sample, and residual definition before describing the variance test. Engle's original ARCH paper developed the test in the setting of a conditional-variance model.
Square residuals to test volatility dependence
Squaring removes the sign while emphasizing large shocks. If a positive and negative residual have equal magnitude, they contribute the same squared value. This is why a test on squared residuals can detect clustering in move size even when ordinary returns have little linear autocorrelation.
For an ARCH(q) diagnostic, regress the squared residual on a constant and q of its own lags:
e_t^2 = a_0 + a_1 e_{t-1}^2 + ... + a_q e_{t-q}^2 + v_t
The null is a_1 = ... = a_q = 0. The intercept remains in the auxiliary regression. The lag order q defines the time window this particular test can detect; it is not estimated automatically by the null hypothesis.
Calculate the LM statistic from the auxiliary regression
Let R^2 be the ordinary coefficient of determination from the auxiliary regression, and let M be the number of usable rows in that regression after aligning the lagged values. Under the null and standard large-sample conditions, the LM statistic M × R^2 is approximately chi-square distributed with q degrees of freedom.
Consider a wholly hypothetical test with q = 5, M = 300 usable rows, and auxiliary-regression R^2 = 0.018. The statistic is 300 × 0.018 = 5.4. The 5% critical value for chi-square(5) is about 11.07, so 5.4 does not cross that cutoff. This example therefore fails to reject the no-ARCH null at the 5% level.
The calculation is a large-sample approximation, not a count of the number of clusters. M is the auxiliary regression's usable sample size, not automatically the full return count. Engle's later Nobel lecture describes volatility clustering in financial returns and the role of conditional-variance models.
Read rejection and non-rejection carefully
A small p-value says the observed squared-residual relationship would be unusual under the stated null and its approximation. It supports investigating conditional variance dynamics, but it does not show that a specific ARCH or GARCH model will forecast well. Outliers, a structural break, an omitted mean pattern, changing market composition, or another form of nonlinear dependence can also produce a rejection.
A large p-value is not proof that variance is constant. The chosen q may miss dependence at other horizons, the sample may have little power, or the model's assumptions may not fit the data. “Fail to reject” is the appropriate language; “accept that returns are homoskedastic” claims more than the test establishes.
The test also says nothing by itself about whether the expected return is positive, whether a signal has economic value, or whether option prices are rich or cheap. Statistical evidence about variance and a tradable forecast are separate questions.
Choose lag order before looking for significance
Select q using the observation frequency, holding horizon, and a diagnostic plan set before inspecting p-values. A daily-return study may ask about a few trading sessions; a monthly macro series may call for a different range. There is no universal lag count that makes every ARCH test valid or powerful.
Too few lags can miss dependence outside the tested window. Too many lags use more degrees of freedom and can make the auxiliary regression noisy, especially in a short sample. Report q and show sensitivity to a small set of defensible alternatives rather than trying many orders and reporting only the smallest p-value.
Check how results change across reasonable sample windows and mean specifications. Multiple testing across lag orders, assets, transformations, and dates raises the chance of a false positive. A visually strong cluster can also be driven by a few extreme observations, so inspect the underlying series and the squared-residual correlogram.
Compare ARCH LM with squared-residual diagnostics
The McLeod–Li approach checks autocorrelations of squared residuals using a portmanteau-style diagnostic. It is related to the ARCH LM question but is not the same auxiliary regression. McLeod and Li's original paper describes squared-residual autocorrelations as a way to diagnose dependence left after fitting an ARMA model.
Ordinary residual autocorrelation checks ask whether the conditional mean has left linear serial dependence. They can look quiet even when squared residuals remain dependent. White’s original paper proposes a heteroskedasticity-consistent covariance estimator for coefficient inference and a separate direct test for heteroskedasticity; see White (1980). Newey and West’s HAC covariance estimator accounts for heteroskedasticity and autocorrelation in coefficient covariance. ARCH LM instead tests lag dependence in squared residuals. Covariance estimators adjust coefficient inference, while ARCH LM tests a specified conditional-magnitude pattern.
Use diagnostics as a set of clues. A useful workflow checks residuals and squared residuals, tests a prespecified lag range, examines breaks and outliers, and then asks whether a variance model adds stable out-of-sample value. The existing volatility clustering and GARCH guide explains the next modeling step; the robust standard errors guide compares covariance estimators.
Use the result as a model check, not a trading trigger
If the diagnostic suggests remaining ARCH dependence, a conditional-variance model may be a candidate for risk forecasts, volatility scaling, or interval construction. Fit it using only information available at each historical date, compare reasonable alternatives, and inspect standardized residuals and squared standardized residuals afterward. A significant test before fitting does not guarantee the fitted model removed dependence.
Evaluate any variance forecast out of sample against simple benchmarks and a loss function suited to the use case. Include volatility jumps, regime changes, market closures, and execution costs if the forecast feeds a trading rule. A lower in-sample test statistic does not demonstrate better risk control or higher net returns.
When reporting the diagnostic, state the return construction, mean equation, sample dates and size, residual definition, q, usable auxiliary-regression rows, R^2, LM statistic, degrees of freedom, p-value, and any lag or window sensitivity. This makes the test reproducible and keeps its conclusion within scope.
Common questions
Q1Does the ARCH LM test tell me whether returns are predictable?
No. It tests a pattern in squared residuals, not directional predictability or the profitability of a strategy.
Q2Does a significant result mean I should fit GARCH?
It makes conditional-variance models worth evaluating, but compare alternatives and test their forecasts out of sample before using one.
Q3What does it mean if the test is not significant?
It means the selected test did not reject its null at the chosen level. It does not establish constant variance or rule out dependence at other lags.
Sources and further reading
Report an issue
We’ll prepare an email with this article link. Mark receives the report only after you send it
Quick check
Read the guide? Check yourself with 3 questions
Question 01
What does the ARCH LM null hypothesis test?
Choose an answer to see the explanation
Options glossary
A time-series model that updates conditional variance from past squared shocks and prior variance; it models volatility persistence, not return direction.
Read the deeper guideCausationA relationship describing how an outcome would differ under a specified intervention or counterfactual change; observed association alone does not identify it.
Read the deeper guideMulticollinearityStrong linear dependence among included regressors that makes their separate coefficients imprecise and sensitive to the sample.
Read the deeper guide