

RSI 70/30 Trading Signals: Read Regime Before Reversal
Learn what RSI 70 and 30 describe, why extreme readings can persist in trends, and how to define and test a complete RSI trading rule.
In this guideTreat 70 and 30 as momentum zones, not commands
Short summary
An RSI reading above 70 describes recent up moves relative to down moves under a chosen calculation. It does not say that price is too expensive or that a top has formed. Read the market regime first, then write the trigger, invalidation, order timing, and costs before testing a rule.
Treat 70 and 30 as momentum zones, not commands
The Relative Strength Index (RSI) compresses recent closing-price gains and losses onto a scale from 0 to 100. The traditional 70 and 30 lines mark unusually strong recent upward or downward movement under that lookback. They are reference zones, not valuation bands, probabilities, or promised turning points. A reading of 74 does not mean a 74% chance of a decline, and it does not identify a fair price. The name can also mislead: RSI compares a market with its own recent price changes; it is not the relative performance of one asset against another. TradingView and Fidelity describe the indicator as a momentum oscillator and call the conventional extremes overbought and oversold, but those labels alone do not specify an order {source:tradingViewRelativeStrengthIndex} {source:fidelityRelativeStrengthIndex}.
Check the calculation before comparing chart readings
The formula is RSI = 100 − 100 ÷ (1 + RS), where RS is average gain divided by average loss over the selected calculation. If the two averages are 0.90 and 0.30, RS is 3 and RSI is 75. That number summarizes the balance of smoothed up and down changes; it is not a forecast. In the common 14-period Wilder method, the first averages are seeded from 14 changes and later updated as (prior average × 13 + current change component) ÷ 14. If the next close is down 0.20, the averages become about 0.8357 and 0.2929, leaving RSI near 74.1. One lower close therefore need not pull a high RSI below 70. Platforms can differ because of the price field, smoothing, seed, and amount of earlier history included. StockCharts documents its warm-up history choice, while TradingView describes its RMA-based implementation; match those settings before comparing values {source:stockChartsRelativeStrengthIndex} {source:tradingViewRelativeStrengthIndex}.
Classify a range or trend before reading an extreme
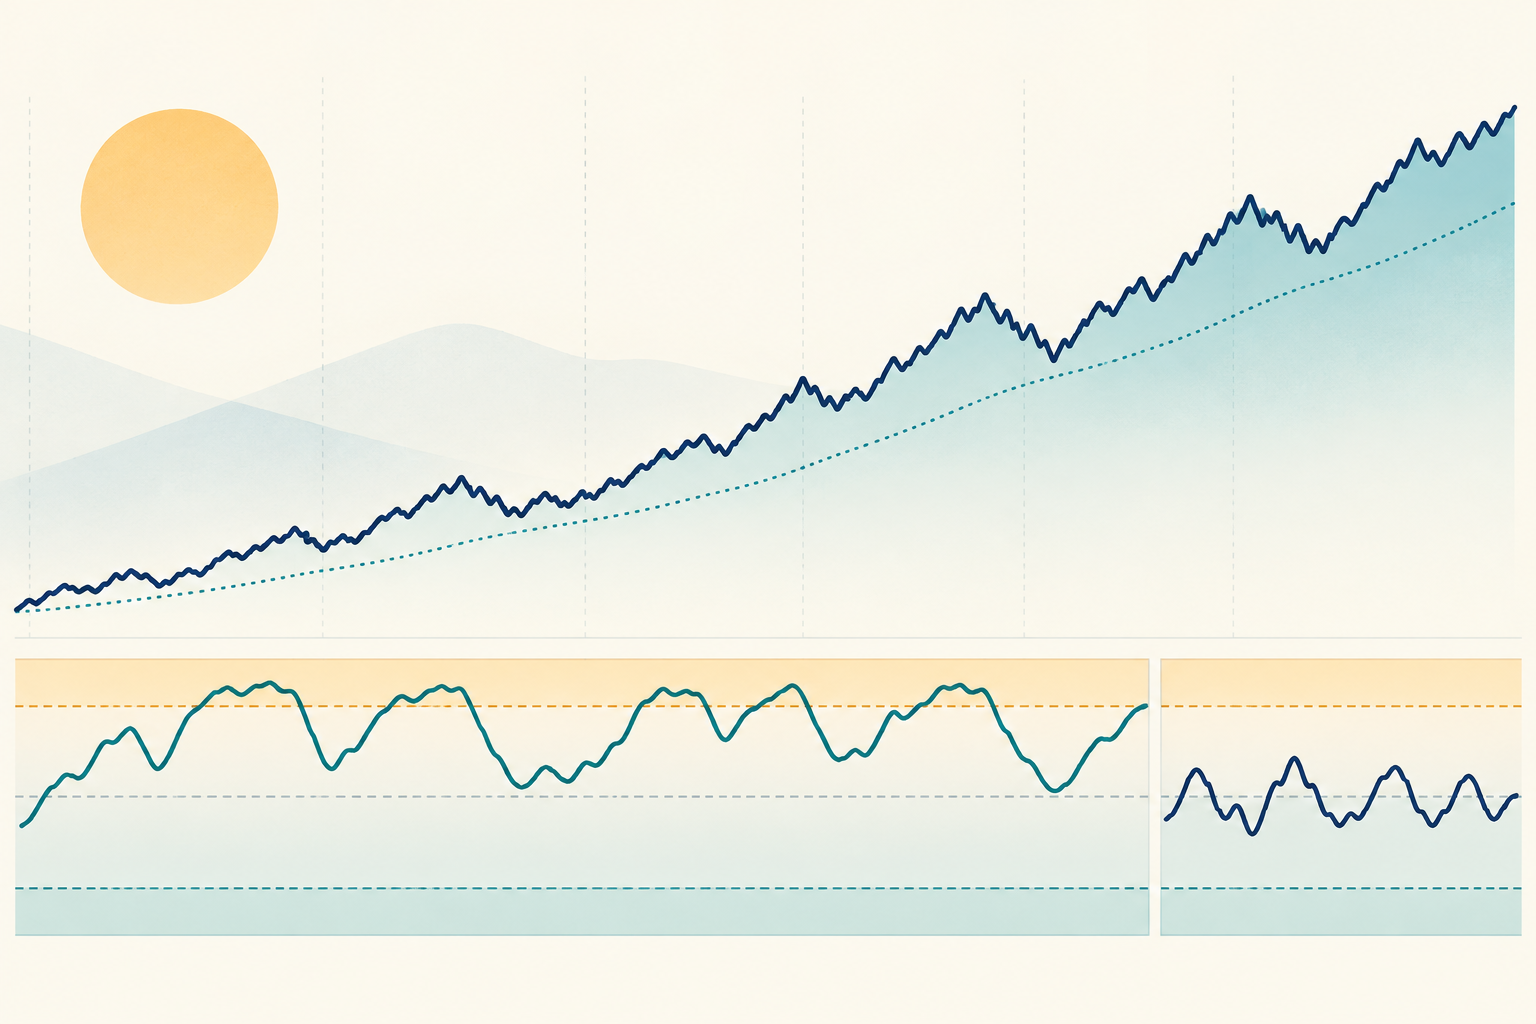
In a bounded, sideways market, RSI near 70 may help flag an upper-range test and RSI near 30 a lower-range test. The price boundary still matters: an oscillator touch cannot show whether buyers or sellers will defend that area. In a persistent uptrend, price can keep making higher highs while RSI repeatedly reaches or stays above 70. In a downtrend, RSI can remain low while price continues to make lower lows. Fidelity describes broad RSI ranges that can accompany uptrends and downtrends, but says they vary with settings and trend strength; treat them as observations, not fixed rules {source:fidelityRelativeStrengthIndex}. Record how the regime is identified—such as a predeclared swing-structure rule—before looking at the RSI outcome. If the market changes regime, mark that change with the same rule rather than relabeling every losing signal afterward.
Turn a reading into a fully specified event
A level touch, a close beyond a level, and a cross back through it are different events. A mean-reversion hypothesis might require a range to be established first, then a close back below 70 after an upper test, plus a price-based sign of rejection. A trend-pullback hypothesis might instead look for RSI to cool toward a middle zone while higher lows remain intact. Neither example is a universal recommendation. TradingView’s built-in RSI strategy, for example, enters when RSI crosses back out of an oversold zone and reverses on a cross back from overbought; that is one explicit platform rule, not evidence that the rule has an edge {source:tradingViewRsiStrategy}. Write whether the signal uses an intrabar value or a completed-bar close, whether the order can fill at that price, what cancels the setup, and what price action invalidates it. Without those details, the backtest may silently trade a rule you would not use live.
Use a hypothetical range to separate signal from risk
Suppose an instrument has been oscillating between 100 and 106 under a rule fixed in advance. Price briefly reaches 106.20 while RSI is 74, then the bar closes at 105.70 with RSI at 69. This sequence records an upper-boundary probe and a close back inside the range. It does not prove that a short trade will work. A testable plan could define a short trigger only after that completed close, an invalidation level above the recent swing, and an exit condition that does not depend on seeing future bars. From an illustrative 105.70 entry to a 106.40 invalidation, price risk is 0.70 units before spread, fees, slippage, and gaps. If the next executable price is worse than the close, the actual risk changes. The numbers are invented to show how a chart event becomes a risk definition, not to suggest a trade or expected return.
Read divergence as a clue about momentum, not a reversal promise
Bearish divergence usually means price makes a higher swing high while RSI makes a lower swing high; bullish divergence is the reverse at lows. The comparison depends on which two pivots count. A pivot is only confirmed after later bars, so marking it at the first high or low can introduce hindsight into a chart or backtest. Divergence can accompany a pause, a correction, or a reversal. It does not establish which outcome follows. One way to make the idea testable is to define a pivot window, require both price pivots to be confirmed, and specify the price event that would confirm or invalidate the setup. TradingView lists divergence and failure swings as RSI interpretations while also presenting trend-confirmation interpretations; the source itself illustrates why one shape should not be promoted to a guaranteed direction {source:tradingViewRelativeStrengthIndex}. For reviewing what happened after entry, separate realized results from price-path measures such as MFE and MAE.
Freeze settings, timing, and data conventions
Fourteen bars means 14 observations on the selected chart, not always 14 calendar days. A 14-period reading on five-minute bars answers a different question from one on daily bars. Close, typical-price, or other input choices change the series; regular-session and all-session bars can also produce different closes. On an unfinished bar, a close-based RSI can move until that bar is complete. Decide whether the signal is confirmed at bar close and model the next executable fill accordingly. If two platforms disagree, compare symbol, session, timeframe, input source, period, smoothing, and warm-up history before treating one as wrong. Keep the displayed indicator settings with the chart or export so another reviewer can reproduce the value.
Test the whole rule, including costs and selection
Write down the hypothesis, regime filter, RSI input and period, threshold event, price confirmation, stop or invalidation, exit, and order timing before measuring results. Use only information available at the decision time. Include commissions, spread, slippage, gaps, and realistic entry timing; a signal at a bar close is not automatically fillable at that close. Keep a chronological holdout or use a walk-forward comparison. If many periods, thresholds, and markets were tried, record the full search and account for selection risk; see the Deflated Sharpe Ratio guide. A result chosen from the same history used to tune the rule is exploratory evidence, not proof of future performance. The same discipline applies to other chart references, including anchored VWAP.
Common questions
Q1Does RSI above 70 mean I should sell?
No. It marks strong recent upward movement under the selected RSI calculation. In a trend it can stay high. A sell rule needs its own regime, trigger, invalidation, order, and risk definition.
Q2Is RSI 14 always calculated over 14 days?
No. It uses 14 bars on the chosen chart. Those could be minutes, hours, sessions, or days, depending on the data and timeframe.
Q3Does RSI divergence predict a reversal?
Not by itself. It identifies a difference between selected price and RSI pivots. Define when those pivots are confirmed and what later price event would validate or invalidate the idea.
Sources and further reading
Report an issue
We’ll prepare an email with this article link. Mark receives the report only after you send it
Quick check
Read the guide? Check yourself with 3 questions
Question 01
A 14-period RSI is 76 during a series of higher highs. What can be concluded from the reading alone?
Choose an answer to see the explanation