

MFE and MAE: Measure the Path Inside a Trade
Learn how maximum favorable and adverse excursion describe a trade's price path, how to express them in R, and why a candle extreme is not a guaranteed fill.
In this guideSeparate the excursion from the result
Short summary
A closing profit tells you how the trade ended. MFE and MAE describe how far price traveled in your favor and against you while the position was open. They are path measurements, not alternative exits you were guaranteed to capture.
Separate the excursion from the result
A realized result records the fills that closed a position, less any costs included in the report. Maximum favorable excursion (MFE) and maximum adverse excursion (MAE) summarize the best and worst price movement available during the trade's defined holding window. For a long, favorable movement is up and adverse movement is down; for a short, the directions reverse.
A trade can reach 1.6 times its initial risk in open profit, pull back, and still close for a 0.75R gain. The 1.6R reading is MFE; 0.75R is the gross realized outcome under the example's risk convention. MFE does not say that a limit exit at the best price would have filled, and MAE does not say the full adverse amount was realized. NinjaTrader's performance definitions calculate excursions relative to entry and distinguish chart-based backtest values from live price tracking {source:ninjaTraderTradeStatisticsDefinitions}.
Fix the position window before taking a maximum
Start with the actual entry fill, not the signal bar's open or close. Stop measuring at the actual exit fill. If an entry occurs halfway through a bar, part of that bar's high-low range may have occurred before you owned the position. If an exit occurs before the bar closes, later movement in that bar is outside the trade. Counting either section overstates an excursion.
For one entry and one exit, use the filled entry price and the price observations from that timestamp through the exit. If the position has partial fills, scale-ins, or partial exits, choose whether you are measuring each entry execution or one combined position. A combined measure needs a documented quantity-weighted entry and a consistent open-quantity rule. Platform reports can group executions differently, so record the convention instead of assuming every report's “trade” means the same thing.
For futures, record the exact contract month and session alongside timestamps. A continuous futures symbol may switch contracts at a roll and may back-adjust history, so its stitched path is not necessarily the path of the contract you traded. Measure against the actual contract behind the fill. If a real position spans a roll, record each contract leg and its quantity before combining currency P&L.
Calculate each measure from the trade side
Let E be the actual entry price. For a long, calculate MFE = max(0, highest in-window price − E) and MAE = max(0, E − lowest in-window price). For a short, calculate MFE = max(0, E − lowest in-window price) and MAE = max(0, highest in-window price − E). Use the best and worst prices only inside the defined open-position window.
The result is a distance in the quote's price units. Convert it to ticks by dividing by the contract's tick size. Convert it to one-contract currency by multiplying by point value; then multiply by the relevant quantity if the position size stayed constant. Keep favorable and adverse values as nonnegative magnitudes, or choose a signed convention and label it. Mixing a negative MAE with a positive “adverse loss” column makes averages hard to interpret.
Work one MES trade from entry to exit
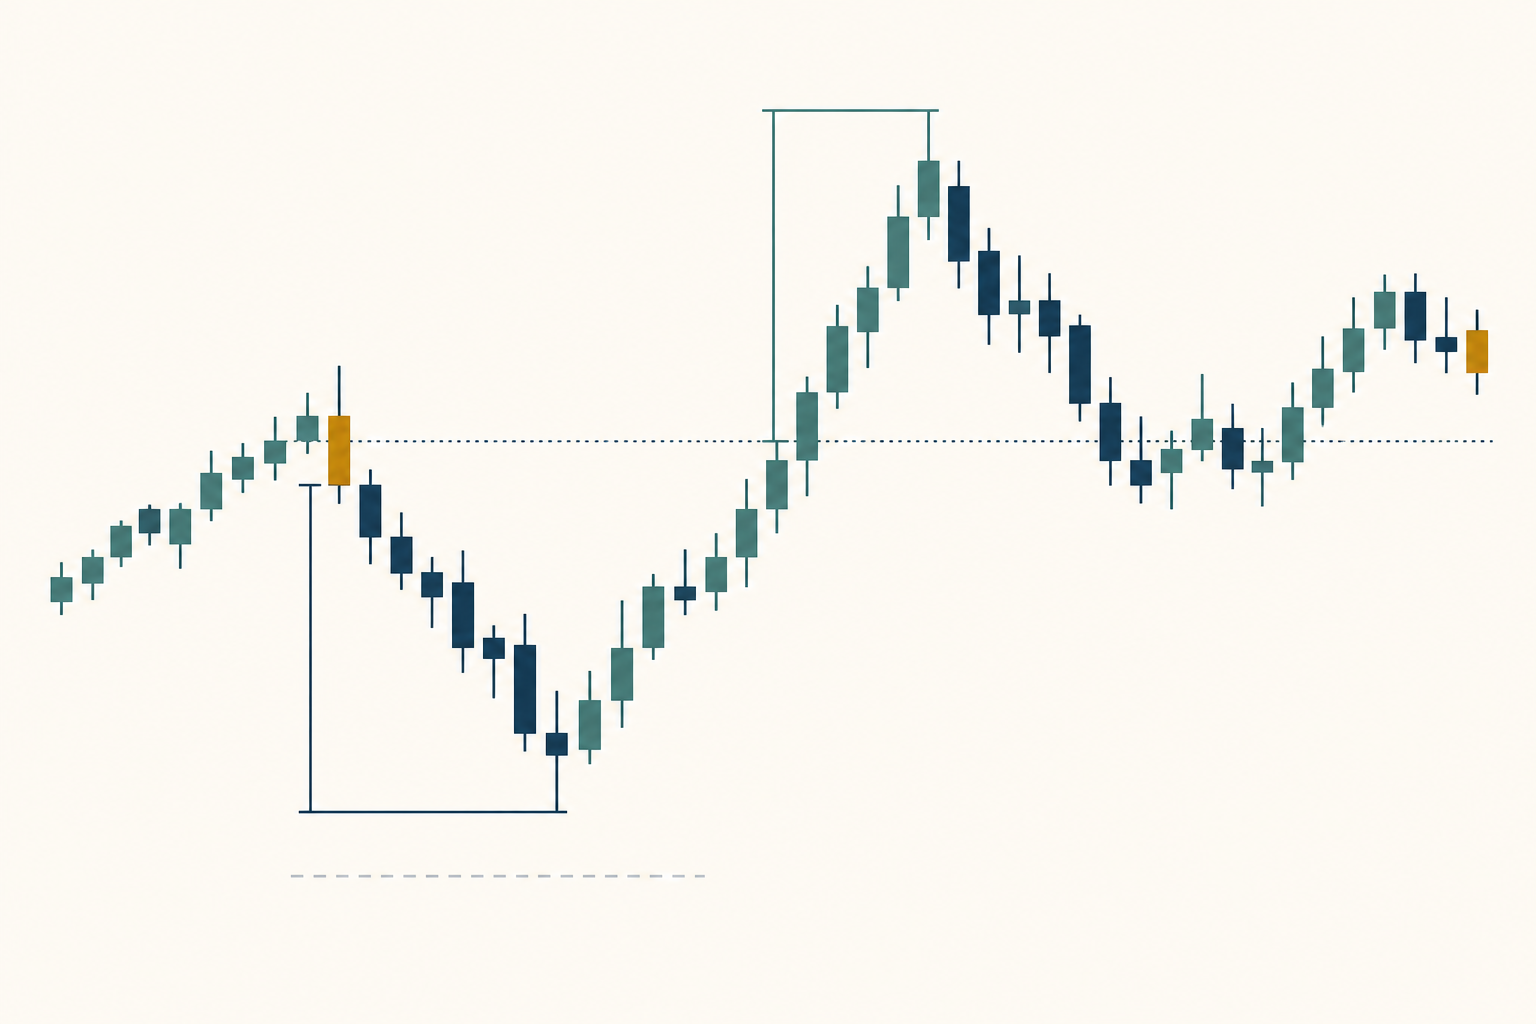
Consider a hypothetical long Micro E-mini S&P 500 futures trade. Entry is 5,200.00 and the initial stop reference is 5,198.00, a 2.00-point distance. The path while the one-contract position is open has four bars: highs of 5,201.25, 5,203.25, 5,202.00, and 5,201.75; lows of 5,199.50, 5,200.75, 5,199.00, and 5,200.50. The position exits at the 5,201.50 close of the fourth bar. The low never reaches the stop reference.
The best price is 5,203.25, so MFE is 3.25 points, or 13 ticks at 0.25 points per tick. The worst price is 5,199.00, so MAE is 1.00 point, or 4 ticks. CME specifies the MES multiplier as $5 per index point and its minimum tick as 0.25 points, which gives a $1.25 tick value {source:cmeMicroEMiniSP500ContractSpecifications}. MFE is therefore $16.25 and MAE is $5.00 per contract before costs. The actual exit is 1.50 points above entry, or $7.50 gross. These invented prices illustrate arithmetic; they are not a trade, current quote, or expected outcome.
Keep price movement, R, and account P&L distinct
In the example, the initial price risk is 2.00 points × $5 per point = $10 per contract. Using that pre-trade gross amount as 1R gives MFE of $16.25 ÷ $10 = 1.625R, MAE of $5 ÷ $10 = 0.50R, and a gross exit result of $7.50 ÷ $10 = 0.75R. The stop distance defines this R denominator; the later MFE does not.
State whether R includes planned fees and spread, or uses price risk before costs. Do not compare a gross excursion with a net result and call the difference “missed profit.” A chart high can differ from the bid available to sell a long, and a chart low can differ from the ask available to cover a short. Commissions, slippage, queue position, and partial fills affect executable P&L. Keep the raw price distances, currency conversion, costs, and realized net result in separate fields.
Respect what the price data can show
A bar's open, high, low, and close set bounds, but they do not always reveal the order in which prices traded between those points. If one bar touches both a stop and a target, OHLC data alone cannot establish which order was reached first. If the bar also contains the entry, its high or low may precede the fill. A precise-looking MFE/MAE number can therefore rest on an assumed path.
Historical simulators choose conventions. TradingView's Pine strategy documentation describes its broker emulator's default intrabar path assumptions and how lower-timeframe detail can refine historical fills {source:tradingViewPineStrategyBrokerEmulator}. Its broker-emulator guide separately describes fill settings, fees, and slippage {source:tradingViewBrokerEmulatorSupport}. Those are platform rules, not proof of the path in another broker's data. Use timestamped trades or quote-side data when the question needs that precision; otherwise disclose the bar interval and classify unresolved same-bar cases conservatively.
Compare distributions without cherry-picking
Review MFE and MAE across a consistent group: the same setup version, instrument, direction, bar or quote basis, position grouping, and R denominator. Include losing trades and report the sample count. A mean can be pulled upward by a few unusually large excursions; a median and selected percentiles show more of the distribution. Long and short trades or different sessions may deserve separate groups when the rules differ.
A losing trade with a large MFE is not automatically an exit failure, and a winning trade with a large MAE is not proof that a wider stop is better. Outcome-based groups are descriptive: a trade stopped at 0.5R would no longer be the same trade that later closed as a winner under a wider rule. The Wiley text on technical-system testing discusses MFE and MAE as additional risk and trade-dispersion views, alongside other measures rather than as a complete performance verdict {source:wileyTechnicalAnalysisSystemDesignAndTesting}.
Turn a pattern into a rule you can test
Use excursions to form a question, not to select a stop or target by eye. For example: “Do trades in setup A that reach at least 1R MFE by the second completed bar retain more net expectancy under a prewritten trailing rule?” Specify the trigger, order behavior, costs, and time limit before evaluating it. Then replay the full rule, because changing an exit changes which trades remain open and what later path is observable.
If several thresholds look attractive in the same sample, record the search and reserve later or untouched data for evaluation. This protects the review from choosing a rule merely because it fits the paths already inspected. A futures trading plan should preserve its setup and stop rules before the review; see how to build a futures trading plan, how to set a futures profit target, and ATR for futures stops.
Common questions
Q1Does MFE mean I could have taken that profit?
No. MFE records a price extreme inside the measured window. A limit order at that extreme may not have been available or filled, and fees, spread, and queue position matter.
Q2Can MAE tell me where to place my next stop?
Not by itself. MAE describes past paths under a specific entry, exit, and data convention. A new stop changes which trades remain open and must be tested as a full rule.
Q3Can I calculate excursions from a chart bar that contains my entry?
Only if you can isolate prices after the fill. If the bar combines pre-entry and post-entry movement, use finer timestamped data or mark the observation as unresolved.
Sources and further reading
Report an issue
We’ll prepare an email with this article link. Mark receives the report only after you send it
Quick check
Read the guide? Check yourself with 3 questions
Question 01
A long MES trade enters at 5,200.00. Its lowest in-trade price is 5,199.00. What is MAE in points?
Choose an answer to see the explanation