

ATR for Futures Stops: Turn True Range Into Contract Risk
Learn how Average True Range includes gaps, how smoothing and chart settings change its value, and how to convert an ATR distance into tick and contract risk.
In this guideWhat ATR measures, and what it leaves out
Short summary
Average True Range (ATR) measures the average size of true ranges in a chosen bar series. It has price units and no direction. Use it as a distance input only after matching the contract, session, timeframe, smoothing, and tick value to the trade.
What ATR measures, and what it leaves out
ATR summarizes the size of recent price ranges. It does not say whether the next move will be up or down, estimate the chance that a stop will hold, or turn a chart into a forecast. A higher reading means the selected series has recently registered wider true ranges; it is not an entry signal or a safe-loss limit. TradingView describes ATR as a volatility measure that can reflect gaps and limit moves ([ATR guide]({source:tradingViewAverageTrueRangeSupport})).
ATR is quoted in the same price units as the chart: index points, dollars per barrel, cents per bushel, or another instrument-specific unit. That is not yet account-currency risk. The contract multiplier, minimum tick, number of contracts, and execution costs still matter.
True Range looks beyond the candle body
For bar t, calculate three distances and keep the largest: TR = max(H − L, |H − C₍t−1₎|, |L − C₍t−1₎|). H and L are the current high and low; C₍t−1₎ is the prior bar close. Absolute values keep the measure nonnegative and directionless.
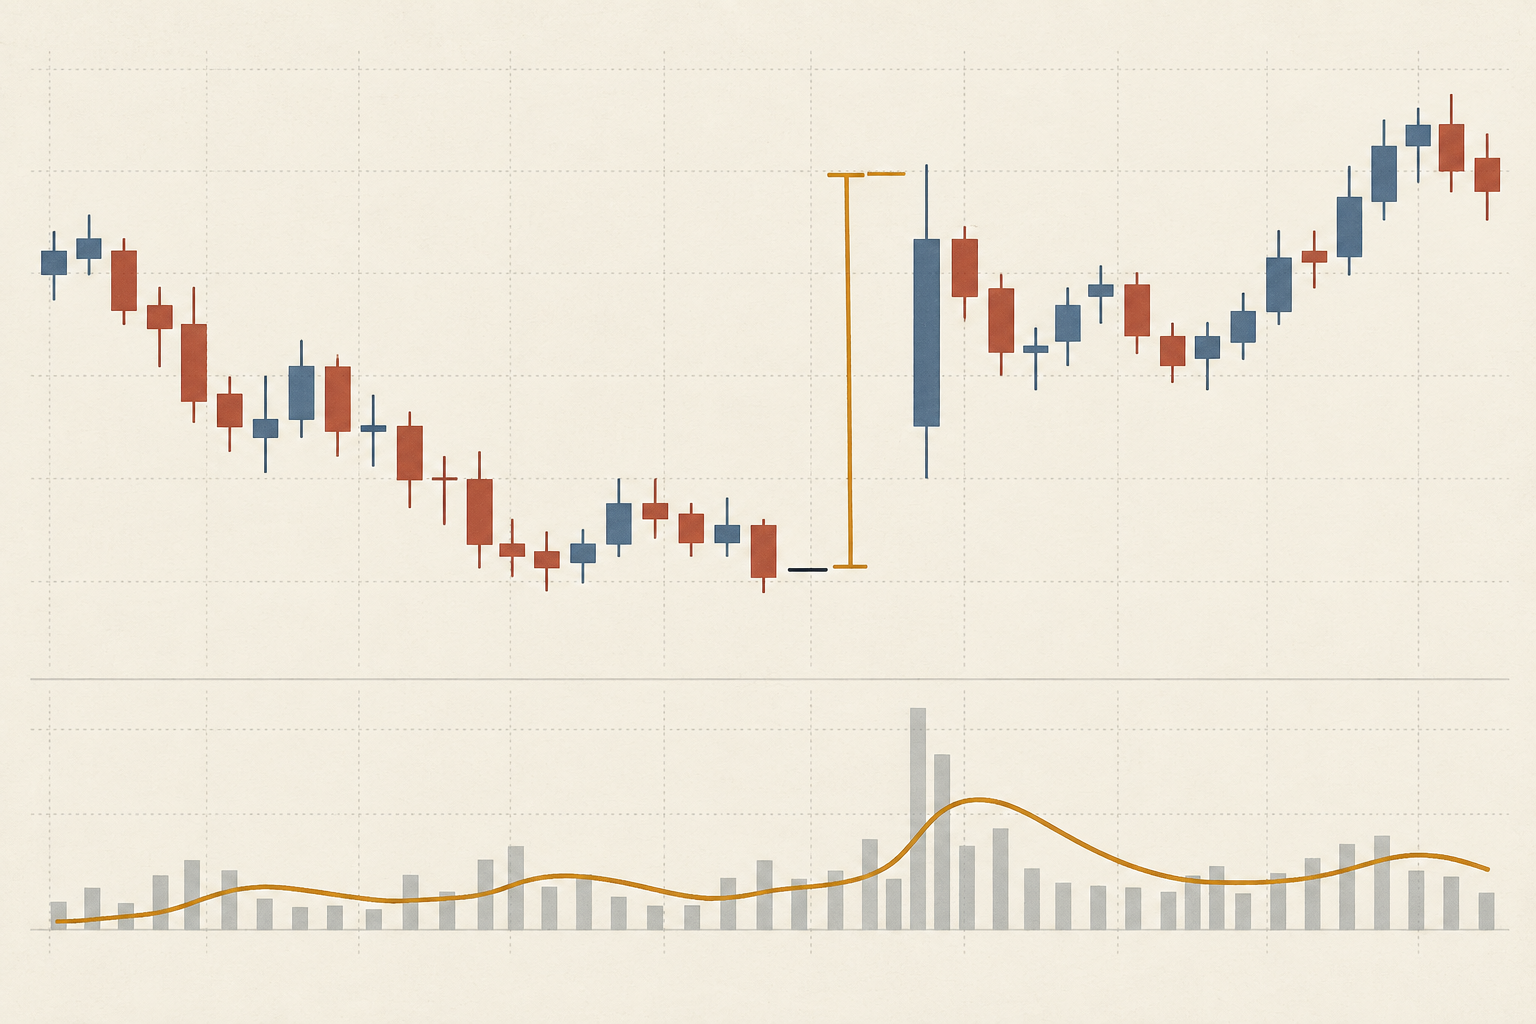
Suppose the previous close is 100.00 and the next bar has a high of 105.20 and a low of 104.40. Its high-low range is only 0.80, but the distance from the old close to the high is 5.20 and to the low is 4.40. True Range is therefore 5.20. The extra distance records the gap between bars rather than pretending the new bar began at the previous close. TradingView documents this three-part calculation; its Pine built-ins note that ta.tr(true) falls back to high minus low when no previous close is available ([built-ins guide]({source:tradingViewPineBuiltins})).
Smoothing changes how quickly ATR responds
A common Wilder-style update for an n-period ATR is ATRₜ = ((n − 1) × ATRₜ₋₁ + TRₜ) ÷ n after the initial value has been seeded. With n = 14, a previous ATR of 1.20 points and a new True Range of 2.60 produce (13 × 1.20 + 2.60) ÷ 14 = 1.30 points. The new bar changes the estimate without replacing the whole history.
On TradingView, the default ATR smoothing is RMA, while the indicator settings can use SMA, EMA, or WMA. Those choices can produce different values from the same bars. Lookback length and initialization also matter. Do not compare a 14-bar RMA on one chart with a 14-bar simple average on another and assume they are identical ([ATR guide]({source:tradingViewAverageTrueRangeSupport})).
Match the chart series to the trade
Write down the product and contract month, bar interval, session definition, data feed, previous-close rule, smoothing type, lookback, and whether ATR uses completed or developing bars. A regular-session-only chart and an all-session chart can assign an overnight move differently. Intraday and daily bars answer different horizon questions. A continuous futures series can also stitch or adjust contract months; verify the actual tradable contract and its rollover treatment before sizing from a large apparent range. See continuous futures charts versus tradable contracts.
If a rule recalculates ATR while a bar is still forming, its high, low, and range may continue to change. A backtest that uses the final bar value for an earlier decision has information it did not have at that time. State whether the decision uses the last completed bar or a live estimate and preserve that timing in alerts and tests.
Translate an ATR multiple into valid ticks
Assume a hypothetical ATR reading of 1.30 index points and a planned distance of 2 ATR. The raw distance is 1.30 × 2 = 2.60 points. CME lists Micro E-mini S&P 500 futures at $5 per index point with a 0.25-point minimum tick. The raw distance is 2.60 ÷ 0.25 = 10.4 ticks, so rounding outward to 11 ticks gives a 2.75-point distance. At $1.25 per tick, that is $13.75 of planned price risk per contract before costs ([CME contract specifications]({source:cmeMicroEMiniSP500ContractSpecifications})).
The multiplier of 2 is only an example, not a recommended setting. Rounding toward the entry would make the stop narrower than the stated distance. For other products, recheck the exact tick increment and tick value; a point or pip does not have a universal cash value. Futures tick value and contract multiplier explains the conversion.
Use the distance to size the position, not to excuse it
Suppose the hypothetical maximum planned loss is $100 and round-trip costs are estimated at $2 per contract. The example denominator is $13.75 + $2 = $15.75 per contract. floor($100 ÷ $15.75) = 6 contracts, for a modeled $94.50 before any stop slippage or gap through the trigger. Seven would model $15.75 × 7 = $110.25, above the stated budget. These are invented numbers, not a trading recommendation or a current fee quote. CME’s [position-sizing lesson]({source:cmeProperPositionSize}) also separates the stop distance from the risk budget.
A stop price is not a guaranteed fill or maximum loss. Fast markets, gaps, partial fills, and stop-limit non-execution can make the realized result worse. If a sensible invalidation point implies too much risk, reduce the quantity, use a smaller contract if appropriate, or skip the trade. Do not pull the stop closer only to force a preferred contract count. Futures position sizing covers the broader budget and scenario check.
Keep ATR separate from the thesis and the signal
Choose the level that would invalidate the trade idea first, then use ATR to describe how wide that distance is relative to recent ranges. An ATR multiple can help compare volatility-scaled rules, but it cannot establish that the level is structurally meaningful, that price will reverse there, or that the strategy has positive expectancy. A 2-ATR stop can be too tight in one setup and unnecessarily wide in another.
Compare instruments only with care. Raw ATR tends to be larger for higher-priced instruments. ATR divided by price (often called ATR%) can normalize that scale, but it still does not convert the result to dollars, equalize liquidity, or account for different contract multipliers. Choose a measure that matches the decision you need to make.
Test and record every setting that defines the rule
Before reviewing results, freeze the lookback, smoothing, timeframe, session, input series, anchor to a completed bar, multiplier, tick-rounding direction, cost allowance, and stop-order assumptions. If you inspect many lengths and multipliers and keep the best chart, record the full search and evaluate the rule on later data. Include spreads, fees, slippage, gaps, and unfilled stops.
A useful record contains the contract month, ATR value and timestamp, prior close, True Range inputs, formula and smoothing, raw distance, rounded ticks, tick value, planned quantity, costs, and actual fill. ATR is a compact range summary; the journal and execution record determine whether the risk estimate was reproducible. For stop placement and order behavior, see how to set a futures stop-loss.
Common questions
Q1Does ATR predict the next price move?
No. ATR measures the size of recent true ranges under its data and smoothing settings. It does not specify direction or guarantee that a similar range will occur next.
Q2Is a 14-period ATR always the right setting?
No. Fourteen is a common default, not a universal optimum. The bar interval, session, instrument, and decision horizon determine what the setting measures.
Q3Should every futures stop be two ATRs away?
No. A multiple is a rule input, not a validated stop for every trade. Define thesis invalidation and risk first, then test any ATR-based distance with realistic tick rounding and execution costs.
Sources and further reading
Report an issue
We’ll prepare an email with this article link. Mark receives the report only after you send it
Quick check
Read the guide? Check yourself with 3 questions
Question 01
The previous close is 100.00; the next bar has a high of 105.20 and a low of 104.40. What is True Range?
Choose an answer to see the explanation