

Anchored VWAP: Choose the Starting Point Without Hindsight
Learn how anchored VWAP changes with its start point, how to choose an event anchor in real time, and how to test an anchor rule without mistaking a chart line for a signal.
In this guideWhat anchored VWAP measures
Short summary
Anchored VWAP is the volume-weighted average price from a chosen starting point. The formula is simple; the anchor is a modeling choice. Decide how and when that point becomes knowable before judging the line, or a chart can quietly use information that was not available at the time.
What anchored VWAP measures
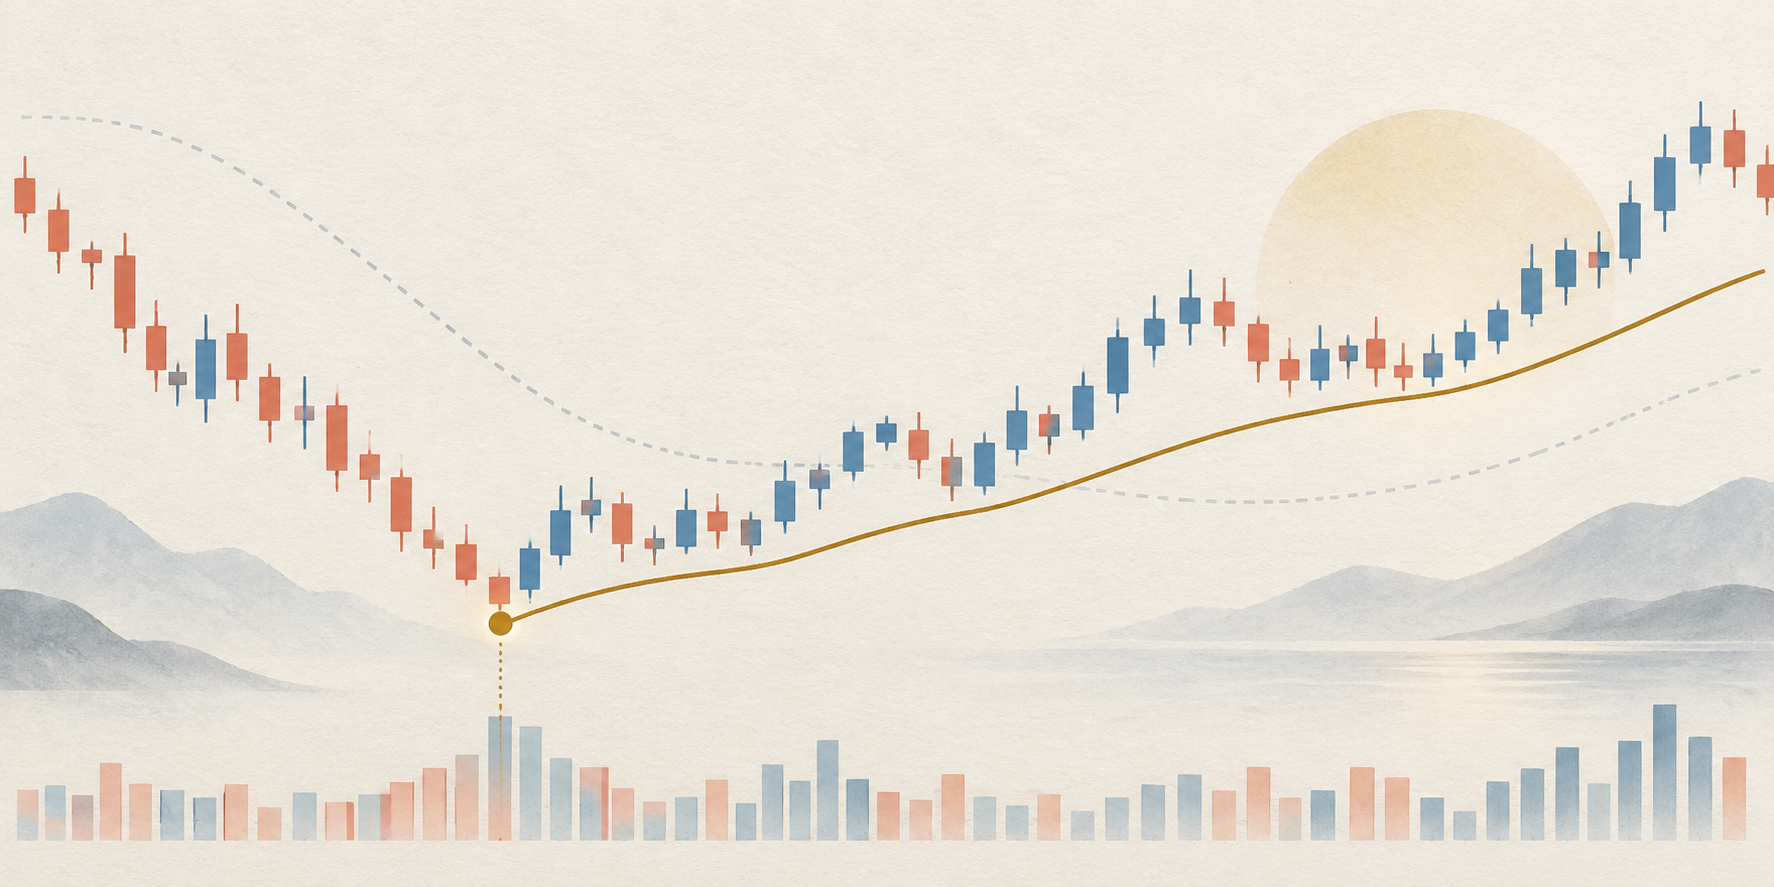
A volume-weighted average price (VWAP) gives more influence to prices associated with more reported trading volume. An anchored version starts that calculation at a user-selected bar or timestamp and accumulates through the current observation. TradingView describes its drawing tool as VWAP beginning at a point the user selects on the chart ([anchored VWAP guide]({source:tradingViewAnchoredVwapSupport})). The line therefore answers a bounded question: what is the average of the chosen price inputs, weighted by the included volume, since this specified start? It does not reveal every holder’s cost basis or predict what price will do next.
The formula depends on the price and volume inputs
For observations i from anchor a through time t, write AVWAP(t) = Σ(Pᵢ × Vᵢ) ÷ ΣVᵢ. Pᵢ is the price input and Vᵢ is the associated volume. If the data are individual trades, Pᵢ can be the execution price and Vᵢ the executed quantity. With bars, a platform may use a representative price such as the bar’s typical price, then weight it by bar volume. Those are not identical calculations. The [Pine Script VWAP reference]({source:tradingViewPineVwapReference}) exposes source and anchor/reset inputs, illustrating why you should record the implementation rather than assume every chart uses the same series.
Choose an anchor that has a reason before the reaction
Possible anchors include a regular-session open, an earnings or macro release, a gap, a known swing point, or the first trading bar after a major event. Each defines a different sample. Prefer a timestamp or event whose meaning can be stated independently of the later outcome: “the first regular-session bar after the scheduled release,” for example, is easier to reproduce than “the low from which price rallied.” A swing high or low can still be a useful descriptive reference, but the pivot is not confirmed at the instant it forms. Specify the event, instrument, venue/session, timezone, and whether the anchor bar is included.
Make the anchor available to the live decision
A chart can place a line at an earlier low after later candles reveal that the low mattered. A trader viewing the finished chart sees a clean anchor; a historical simulation that acts from the low may be using future confirmation. For a live rule, define a confirmation condition and the first eligible decision time. If a pivot requires two later bars to confirm, the test cannot act at the pivot timestamp unless the strategy could know it then. For a scheduled release, state whether the anchor is the release timestamp, the first eligible trade, or the next regular-session bar; each choice handles gaps and off-hours volume differently.
Work one hypothetical calculation by hand
Assume three successive bar-price inputs and volumes: 100.00 with 2,000 units, 102.00 with 1,000, and 101.00 with 3,000. The weighted numerator is 200,000 + 102,000 + 303,000 = 605,000 price-units; total volume is 6,000, so AVWAP is 605,000 ÷ 6,000 = 100.8333. The plain average of the three inputs is 101.00, a different answer because the 101.00 bar carries the most volume. If the anchor is moved to the second bar, the calculation becomes (102,000 + 303,000) ÷ 4,000 = 101.25. Both calculations are correct for their stated windows; the 0.4167 difference comes from changing the sample, not from a new market fact. The inputs are invented and the price-unit arithmetic is illustrative, not observed data.
Read the line as a reference, not a crowd cost basis
If the current quote is above the chosen AVWAP, it is above that sample’s volume-weighted average input price. That may help compare price with a defined event window, but it does not mean all buyers since the event are profitable: participants traded at many prices, may have opened and closed positions, and may not belong to the data feed. Nor does a touch or cross establish support, resistance, institutional buying, or a reversal. A line can rise while price falls if the accumulated high-volume observations are expensive; it can flatten when fresh volume is small. A chart label compresses the sample, it does not explain the cause of subsequent price action.
Test the selection rule, not the prettiest historical line
If you try many anchor dates, event definitions, bar sizes, price inputs, and exit rules, then keep the best-looking combination, the result has been selected from a search. Bailey and coauthors discuss the probability of overfitting investment backtests ([paper]({source:baileyProbabilityBacktestOverfitting})); White’s Reality Check addresses data snooping across a family of rules ([paper]({source:whiteRealityCheck})). These methods do not validate an anchored-VWAP strategy automatically. Write the anchor and entry/exit rule first, include every tried variant in the search record, use chronological evaluation, and compare net results after spread, fees, slippage, and incomplete fills. A line that appears to work on a handpicked chart is a hypothesis, not evidence of a repeatable edge.
Keep the chart settings and market data reproducible
Record symbol and contract, exchange or feed, session calendar, timezone, bar interval, price source, volume unit, adjustment policy, anchor rule, and confirmation delay. Equity charts may differ on premarket prints and split-adjusted history; futures trade across sessions and roll between contracts; spot FX volume can be provider-specific; crypto venues can report different activity. A data correction, missing bar, or session reset can change the cumulative denominator and move the curve. Use the same convention in the chart, alert, and backtest, and inspect a second data source if the result depends on a small set of prints. The VWAP versus TWAP guide separates chart references from execution benchmarks; order flow imbalance explains a different order-book measure.
Common questions
Q1Is anchored VWAP the same as session VWAP?
Both use volume-weighted price averaging, but session VWAP commonly resets at a session boundary while anchored VWAP starts from a user-selected point. The exact price input, session filter, and treatment of the anchor bar can differ by platform.
Q2Which anchor is best?
There is no universally best anchor. Choose one that corresponds to a clearly stated question and can be identified without looking at the later price response. If it requires a pivot confirmation, include the delay in live analysis and testing.
Q3Does price crossing anchored VWAP mean it is support or resistance?
No. A cross says that price moved through a chosen sample average under the chart’s data convention. It does not establish why price moved or whether a future touch will hold; test any trading rule after costs and against a defined baseline.
Sources and further reading
Report an issue
We’ll prepare an email with this article link. Mark receives the report only after you send it
Quick check
Read the guide? Check yourself with 3 questions
Question 01
What changes when the same price and volume data are calculated from a later anchor?
Choose an answer to see the explanation
Options glossary
Clear definitions of essential option terms, from calls, puts, and option chains to IV, Greeks, open interest, and max pain
Browse the options glossary