

VWAP vs. TWAP: Benchmarks and Execution Algorithms Explained
Compare VWAP and TWAP market benchmarks with the execution schedules that share their names, including a worked example and key limitations.
In this guideVWAP and TWAP answer different averaging questions
Short summary
VWAP weights traded prices by market volume, while TWAP averages prices across equally spaced times or intervals. Those names also describe execution algorithms: a VWAP schedule follows an estimated market-volume profile, while a basic TWAP schedule slices an order evenly over time. A benchmark is a measuring stick; a schedule is a decision about when to trade. Neither schedule guarantees a better price or a complete fill.
VWAP and TWAP answer different averaging questions
Volume-weighted average price (VWAP) asks what the average traded price was after giving greater weight to intervals or trades with more volume. With trade prints (p_j) and their quantities (v_j), the market VWAP over a chosen window is:
VWAP = Σ(p_j × v_j) ÷ Σv_j
A trade of 10,000 shares therefore matters ten times as much as a trade of 1,000 shares. Market-data providers may aggregate prints into bars, but the result depends on the included venues, trade corrections, price field, session boundary, and whether volume is measured in shares, contracts, or base units. State those choices before comparing two VWAP numbers.
Time-weighted average price (TWAP) asks for the average price over elapsed time. In continuous notation it is the time average of price over a window; with equally spaced observations it is the arithmetic mean of the selected prices:
TWAP = (p₁ + p₂ + ... + pₙ) ÷ n
If observations cover unequal durations, a defensible discrete estimate weights each price by the amount of time it represents. A plain average of one-minute and thirty-minute bars would silently give those unequal periods the same weight. The sampling rule, price input (such as trade, midpoint, or bar average), and start and end times are part of the benchmark definition, not formatting details.
The averages can differ even when they use the same price observations. VWAP gives more influence to busy periods; equally sampled TWAP gives each interval equal influence. Neither is automatically the asset’s fair value, the price available for a large order, or a prediction of the next move.
A benchmark is not the algorithm that uses it
A benchmark is calculated from market observations to assess an execution. An execution algorithm is a set of instructions for dividing a parent order into child orders over a time window. Providers use the same shorthand for each, which can make “beat VWAP” sound like a single, precisely defined objective when it is not.
A basic TWAP algorithm divides the target quantity into equal slices at regular time intervals, or aims for a roughly constant trading rate. A basic VWAP algorithm instead distributes its target across time according to a forecast of the market’s intraday volume curve. If history suggests that 30% of the session’s volume usually occurs in one interval, the schedule may assign about 30% of its own target quantity to that interval. The BIS Markets Committee describes the same broad contrast for FX: VWAP algorithms seek to trade more in periods when higher market turnover is expected, unlike a linear TWAP schedule.
These are reference schedules, not universal implementations. A broker can cap participation, pause for a spread or volatility threshold, use passive orders, or change pace when actual volume departs from the forecast. An order can also be benchmarked to VWAP while being executed with a TWAP schedule, or measured against TWAP after a different schedule. Ask which market price series defines the benchmark and what constraints govern the schedule.
Work through one six-interval example
Assume six equal 30-minute intervals with these hypothetical average prices and market volumes. Volume is shown in thousands of shares; all figures are invented for this calculation.
| Interval | Average price | Market volume (thousand shares) | VWAP schedule for a 1,200-share order | TWAP schedule |
|---|---|---|---|---|
| 1 | $100.00 | 10 | 120 | 200 |
| 2 | $100.50 | 20 | 240 | 200 |
| 3 | $99.80 | 30 | 360 | 200 |
| 4 | $100.80 | 25 | 300 | 200 |
| 5 | $101.20 | 10 | 120 | 200 |
| 6 | $100.30 | 5 | 60 | 200 |
The total market volume is 100,000 shares. Multiplying each interval price by its market volume gives $1,000 + $2,010 + $2,994 + $2,520 + $1,012 + $501.50 = $10,037.50 when volume is expressed in thousands. Dividing by 100 gives a market VWAP of $100.375. The six equal-duration prices sum to $602.60; dividing by six gives a TWAP of about $100.4333.
A 1,200-share VWAP-shaped schedule assigns 1.2% of each interval’s market volume to the order, resulting in 120, 240, 360, 300, 120, and 60 shares. The basic TWAP schedule sends 200 shares in each interval. To show how the schedules can produce different fills, suppose—only in this deliberately simplified example—that every child order fills exactly at that interval’s listed average price, the order completes, and fees and market impact are zero.
Under those assumptions, the VWAP-shaped order’s average fill is $100.375, because its quantities follow the same weights as the market VWAP calculation. The TWAP order’s average fill is $100.4333. For a buy, the latter is about 5.81 basis points above the market VWAP. On a fully completed 1,200-share order, that gap equals about $70 in additional purchase cost under the same assumptions: (100.4333 − 100.375) ÷ 100.375 × 10,000. This is arithmetic, not evidence that a VWAP algorithm would actually achieve that result. In live trading, child orders change the available liquidity and encounter bid–ask spreads, partial fills, changing prices, and fees.
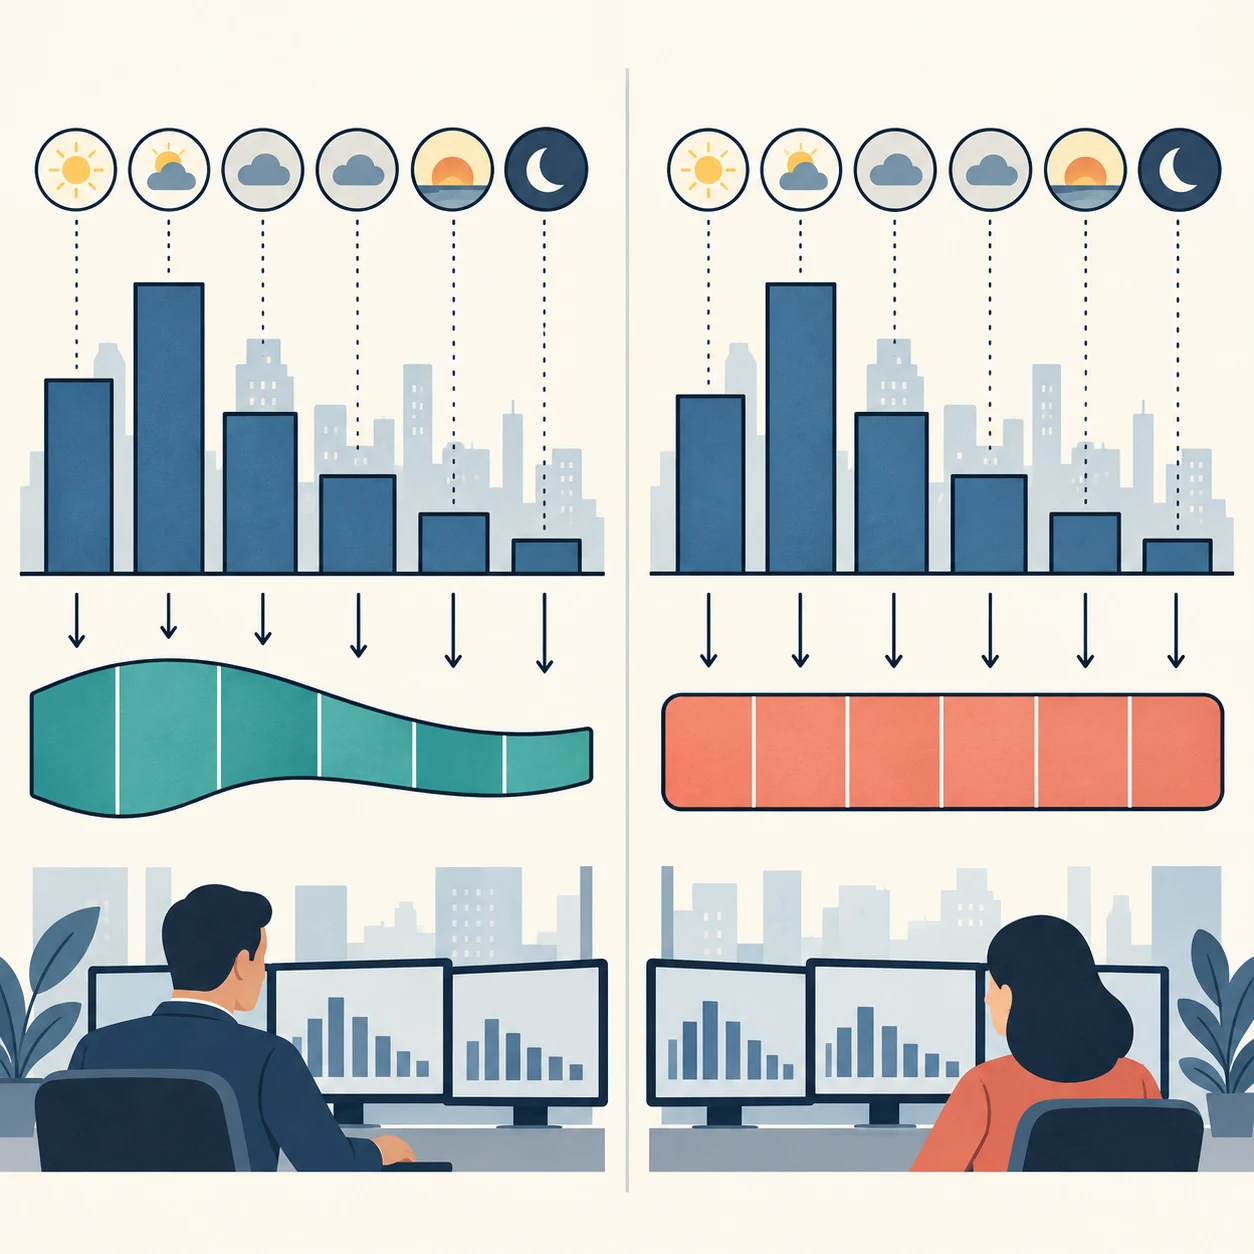
Expected volume curves can be wrong
A VWAP schedule needs an estimate of when market volume will arrive. A common starting point is historical volume for comparable sessions, perhaps adjusted for day of week or a known event. But realized volume can shift after news, a volatility shock, a market opening, or a change in venue participation. A schedule that follows yesterday’s profile too literally may trade too slowly before a price move, or concentrate too much activity in a period that turns out to be thin.
Some algorithms update their estimate as the session unfolds. Busseti and Boyd’s VWAP execution model explicitly treats total market volume as uncertain and studies incorporating information observed during execution. Cartea and Jaimungal derive two VWAP-targeting strategies: one adjusts a TWAP-like schedule for current and expected remaining order flow, while the other adjusts an Almgren–Chriss schedule using expected remaining volume and net order flow. These papers show why “VWAP algorithm” does not mean a fixed, universally optimal curve: model assumptions, impact costs, risk preferences, constraints, and new observations all affect a schedule.
TWAP avoids the need to forecast a market-volume curve for its basic pacing rule, but it does not avoid market risk. Equal slices may trade too aggressively during quiet periods and too passively during busy periods. A fixed schedule can also expose the order to price changes throughout the window. Greater urgency may improve the chance of completion but raise spread and impact costs; slower pacing may reduce footprint but leave more quantity exposed to an adverse move or unfinished at the deadline.
Choose a schedule from the trading objective
A volume-following schedule can be a reasonable starting point when the task is to participate in normal market activity across a substantial part of a session. It aims to distribute a parent order in proportion to expected market turnover, which may reduce concentration relative to trading the whole quantity at once. In its illustrative VWAP example, the BIS report says users can set how tightly the algorithm follows its schedule and that the algorithm aims to complete by a specified end time. The schedule therefore depends on participation limits and deadline instructions, not just the label VWAP.
A time-following schedule can be easier to explain and audit when the objective is to spread activity evenly over a defined period, or when a reliable volume profile is unavailable. It is not automatically the lower-impact choice. In a market with a pronounced opening and closing concentration, equal time slices can place too much of the order into low-volume intervals.
For either method, urgency and completion risk may matter more than benchmark tracking. A short deadline, thin book, large parent order, volatile news window, or venue fragmentation can make the historical profile a poor guide. A limit price can prevent fills beyond a chosen threshold but makes completion uncertain. A marketable order improves immediacy but can pay through the spread and consume displayed depth. The right question is not “which acronym is better?” but “what cost, timing, participation, and completion trade-off does this instruction accept?”
A chart VWAP is a reference line, not a trade signal
Charting tools often display a session VWAP, sometimes with bands or a user-selected anchor. This is the same volume-weighted average calculation applied to trades since the chosen start point, shown as a changing reference line. Traders may compare price with that line, but the formula alone does not say whether crossing it predicts a return, identifies fair value, or offers a profitable entry. Those are separate hypotheses that require a defined horizon, realistic fills, fees, and out-of-sample evaluation.
An anchored VWAP changes the sample by changing the start time. Session VWAP, a VWAP anchored to an earnings release, and a rolling VWAP can therefore show different values without any arithmetic error. Thin markets, fragmented venues, off-session prints, bad ticks, and different bar conventions also affect the calculation. Compare charts only after checking their data and anchoring rules.
A chart’s VWAP line is also not necessarily the same number as an execution report’s VWAP benchmark. One may include a different session, venue set, trade condition, or timestamp boundary. An execution review needs a benchmark definition agreed before the order; visual similarity between two plotted lines is not proof that their underlying observations match.
Measure the execution with matching data and costs
For a buy, an average fill above the chosen benchmark is adverse; for a sell, an average fill below it is adverse. A simple side-aware comparison is s × (average fill price − benchmark price), where s = +1 for a buy and s = −1 for a sell. To express the difference in basis points, divide the signed price difference by the benchmark and multiply by 10,000. State whether the calculation covers filled quantity only, and report unfilled quantity separately rather than treating an incomplete order as a successful benchmark match.
An execution review should record the parent-order decision and arrival times, the security and side, intended and executed quantity, every fill, the benchmark window and market-data convention, fees, schedule constraints, and the final treatment of any remainder. Compare orders with similar urgency, size relative to market volume, volatility, and time of day. If one algorithm receives only easier orders, a lower average cost may reflect order selection rather than better execution.
For the liquidity mechanics behind partial fills and price movement, see order-book imbalance and futures spread and slippage.
VWAP and TWAP do not measure the whole investment decision
VWAP and TWAP compare fills with market prices observed during a chosen window. They do not, by themselves, capture every cost of the portfolio decision. If a buy order fills only half its target before the price rises, comparing just the executed shares with market VWAP can omit the exposure that was never acquired. The corresponding sell case can omit shares that remained exposed to a later fall.
Implementation shortfall asks a broader decision-to-portfolio question: it can compare the realized and unfilled position with the original decision price, while accounting for explicit fees under a stated convention. The implementation shortfall guide explains the decision price, arrival price, fills, remainder, and valuation horizon. A VWAP or TWAP score and implementation shortfall can both be useful, but they answer different questions; use them together only when each benchmark and cost component is defined clearly.
Ask for the schedule and benchmark definitions
Before interpreting an algorithm report, check whether “VWAP” or “TWAP” names the target benchmark, the execution schedule, or both. Confirm the benchmark’s start and end times, price field, venue and trade filters, and the treatment of auctions. For the schedule, ask how child-order quantities are set, whether the rate adapts to live volume, what participation caps and price limits apply, how the algorithm handles volatility or missing data, and what happens at the deadline.
Then separate schedule adherence from execution quality. A schedule can closely track its target curve yet receive poor prices if the market moves or impact is high. Conversely, a schedule can deviate from its planned curve and still get favorable fills. A benchmark score summarizes one comparison under stated rules; it does not prove the algorithm caused the price path, minimized total transaction costs, or outperformed an alternative that could not be observed at the same time.
Frei and Westray model VWAP execution with a stochastic market-volume curve and temporary market impact, illustrating how assumptions about volume and execution cost enter even a formal optimization problem. Use benchmark results as one view of execution, then assess completion, fees, impact, and the original decision objective separately. A historical average does not promise the same outcome on the next order.
Common questions
Q1Is VWAP better than TWAP for every large order?
No. VWAP may suit an order intended to participate in expected market volume, while TWAP may suit an even time-spread pace when the volume profile is unreliable. Urgency, liquidity, price limits, fees, impact, and completion risk matter more than the acronym alone.
Q2Does an execution algorithm guarantee a fill at the VWAP or TWAP benchmark?
No. The algorithm chooses or adjusts a schedule, but market prices, available liquidity, participation limits, and the remaining deadline can change. A benchmark is a comparison price, not a guaranteed execution price.
Q3Why does the VWAP on my chart differ from a broker report?
The chart and report may use different start and end times, venues, trade filters, price fields, auction prints, or session boundaries. Compare those definitions before treating the difference as an error.
Sources and further reading
Report an issue
We’ll prepare an email with this article link. Mark receives the report only after you send it
Quick check
Read the guide? Check yourself with 3 questions
Question 01
What is the defining difference between market VWAP and an equal-interval TWAP?
Choose an answer to see the explanation