

Heikin-Ashi Candles: Formula, Synthetic Prices, and Real Fills
Learn how Heikin-Ashi candles smooth bars, why their OHLC values are not traded prices, and how to separate a visual signal from order execution
In this guideSeparate the candle picture from traded prices
Short summary
Heikin-Ashi candles reuse ordinary bar data in a recursive averaging formula. Their smoother bodies can make a run of prices easier to read, but the resulting open, high, low, and close are chart values, not a second set of trades. Calculate one bar, inspect where a synthetic wick can land, then keep signal logic and executable prices separate.
Separate the candle picture from traded prices
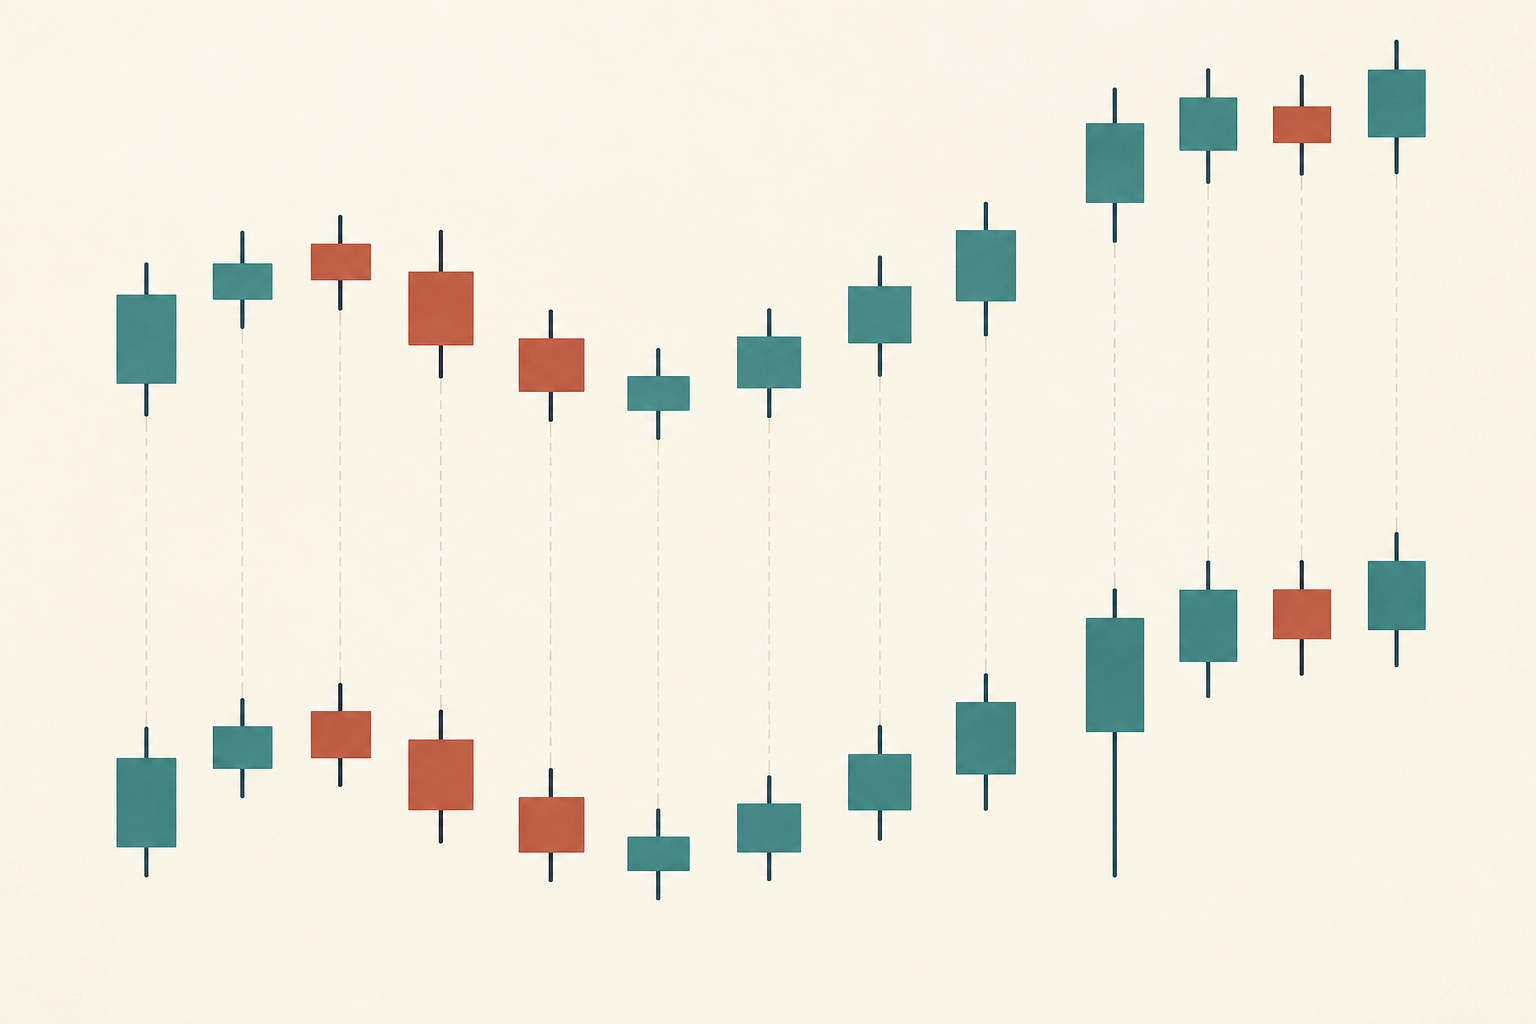
A standard candle reports the instrument’s open, high, low, and close for a bar. Heikin-Ashi (HA) transforms those values: its close averages the current ordinary OHLC, while its open depends on the previous HA open and close. That recursion reduces some bar-to-bar visual variation, but it also means an HA candle does not reproduce the exact path of transactions. TradingView describes HA values as averages rather than actual prices and notes that they are less precise for choosing exact entries and exits. Use the display to describe a chosen smoothing rule, not to relabel a synthetic level as the market’s last price, support, or available fill. {source:tradingViewHeikinAshiGuide}
Calculate each field from the right inputs
For a current ordinary bar with open O, high H, low L, and close C, HA_Close = (O + H + L + C) / 4. The recursive HA_Open = (previous HA_Open + previous HA_Close) / 2. Then HA_High = max(H, HA_Open, HA_Close), and HA_Low = min(L, HA_Open, HA_Close). The current close uses current bar OHLC; the current open carries the prior HA state forward. A bullish HA body under the usual color rule means HA_Close > HA_Open, not necessarily that the ordinary bar itself closed above its open. The formula determines four derived values; a chart may separately offer a color convention based on the previous close, so record which coloring you are reading.
Use a gap example to spot a synthetic wick
Suppose the prior HA open is 100 and prior HA close is 102. The current instrument bar opens at 110 after a prior actual close of 108, reaches 112, falls to 109, and closes at 111. The current HA open is (100 + 102) / 2 = 101. Its close is (110 + 112 + 109 + 111) / 4 = 110.5. The HA high is 112 and the HA low is min(109, 101, 110.5) = 101. The actual bar traded no lower than 109, yet the HA wick extends to 101 because its recursive open is part of the synthetic low. TradingView’s formula uses the current high or low together with HA open and close for those extrema. A historical touch of 101 on this HA bar is therefore not proof that an order could have traded there. {source:tradingViewHeikinAshiGuide}
Carry the example one bar forward to see the recursion persist. Using HA open 101 and HA close 110.5 as the prior state, let the next actual bar run from O=114, H=116, L=113.5, C=115. Its HA open is (101 + 110.5) / 2 = 105.75, its HA close is (114 + 116 + 113.5 + 115) / 4 = 114.625, and its HA low equals that synthetic open. The actual bar traded only between the low and high listed above. The inherited synthetic open therefore leaves another wick below the bar’s real low; it is a calculated chart value, not an observed trade. {source:tradingViewHeikinAshiGuide}
Read smoothing as a display tradeoff
The recursive open gives the display memory: each new HA open is halfway between the previous HA open and previous HA close. A change in the previous HA close therefore moves the next HA open by half as much, all else equal. Averaging O, H, L, and C for the current HA close can also make the body differ in color and size from the ordinary candle. Long same-color runs may be easier to see, but smoothing does not remove gaps, fees, adverse selection, or the possibility of a sharp reversal. It also changes the location and sometimes the range of a candle. A visual pattern is a description of the transformed series; it is not, without a separately tested rule, evidence that price will continue or reverse.
Treat color and wick patterns as descriptions
The color rule and wick shape can be used as concise labels for what the transform produced. For example, some chart readers call a bullish candle with little or no lower wick a strong-looking up bar. That phrase describes the drawn HA values; it does not establish that buyers controlled every trade, that a live stop belongs at the HA low, or that the next bar will match the pattern. A platform may color candles from HA close versus HA open or, with a separate option, compare the close to the previous close. Those choices can make the same OHLC data look different. State the color rule and candle formula before counting runs, doji-like bodies, or wick changes in a study.
Freeze the bar, session, and initialization rules
HA is built from bars, so the underlying timeframe and session define which ordinary OHLC values enter each calculation. A five-minute bar built from regular hours can differ from one that includes extended trading; a daily bar boundary follows the venue’s calendar and timezone. Splits, futures rolls, missing bars, and adjusted versus unadjusted histories can also change the raw inputs. Because HA_Open is recursive, the initial seed and amount of history loaded can affect early values; the influence of a seed decays through repeated averaging but should not be hidden in a reproducibility check. Record symbol, venue, timeframe, session, price adjustments, history start, and the platform’s HA convention. Current-bar values can change before that ordinary bar closes. {source:tradingViewPineChartInformation}
Keep chart signals separate from backtest fills
A chart signal and a strategy fill are separate calculations. TradingView warns that backtests on non-standard charts can use synthetic chart OHLC for order fills and therefore may not represent real market conditions. For Heikin-Ashi charts specifically, TradingView’s Pine declaration offers fill_orders_on_standard_ohlc: when enabled, the broker emulator uses standard OHLC data for simulated fills; its default is false. That setting changes simulated fill prices, not the HA formula used by chart-based signal logic, and it does not make other synthetic chart types equivalent to standard prices. If a backtest reports an HA signal and an HA-priced fill, inspect both data series before interpreting the result. {source:tradingViewNonstandardChartBacktesting} {source:tradingViewPineStrategyDeclaration}
Write an executable rule in actual-price terms
Write the rule in two stages. First say what the HA series contributes: for example, a completed HA close above its HA open may be a filter for an entry condition. Then define the order using actual market prices: submission time, order type, trigger source, acceptable price, exit, size, gap handling, and costs. If the order is a stop at an HA low, convert that idea into a rule tied to tradable raw prices rather than assuming the synthetic level existed in the market. Compare the strategy with ordinary OHLC execution and a suitable baseline over the same dates; keep a chronological holdout or walk-forward evaluation for choices made during development. A smoother chart does not prove better execution or future performance.
Common questions
Q1Are Heikin-Ashi prices actual prices?
No. HA OHLC values are derived from ordinary bars and the previous HA state. Standard market prices remain the basis for deciding whether an order could execute.
Q2Can I place a stop at the Heikin-Ashi low?
You can write a strategy that references that value, but the HA low may not have traded. Define the stop and its trigger using actual prices and model gaps and execution.
Q3Does using standard OHLC for fills remove all Heikin-Ashi backtest bias?
No. It can change simulated fills to standard OHLC on supported HA strategies, but the signal may still use synthetic HA values. It does not establish future performance or realistic costs.
Sources and further reading
Report an issue
We’ll prepare an email with this article link. Mark receives the report only after you send it
Quick check
Read the guide? Check yourself with 3 questions
Question 01
How is the current Heikin-Ashi close calculated?
Choose an answer to see the explanation
Options glossary
Clear definitions of essential option terms, from calls, puts, and option chains to IV, Greeks, open interest, and max pain
Browse the options glossary