

Keltner Channels: ATR Bands, Trend Context, and Breakouts
Learn how Keltner basis and ATR envelopes are calculated, why platform variants differ, and how to read a band cross without treating it as a trade by itself
In this guideRead the basis and envelopes as separate measurements
Short summary
A Keltner Channel places a moving-average basis between two envelopes set a multiple of average true range away. That simple description hides choices that change the lines: the original range-based construction differs from the widely used EMA-plus-ATR form, and platforms choose different averages and defaults. Learn the exact inputs before reading a close outside a band as strength, extension, or a trade.
Read the basis and envelopes as separate measurements
The basis is a chosen moving average of price; the upper and lower lines add and subtract a range measure. A common modern form is upper = EMA(price, n) + k × ATR(m) and lower = EMA(price, n) − k × ATR(m). The basis says where that average sits. The distance to each envelope says how large a recent price range is under the selected ATR calculation. Those are related but different measurements, so a band is not a confidence interval, a valuation estimate, or a fixed percentage from price. TradingView describes a Keltner basis with ATR-based envelopes and makes the average type and range inputs configurable. {source:tradingViewKeltnerChannels}
Distinguish the original channel from the modern ATR version
Chester Keltner’s 1960 construction used a 10-day simple moving average of typical price, (high + low + close) ÷ 3, with bands offset by a 10-day average of the high-low range. The version many chart users now call Keltner replaces that range with ATR and commonly uses an exponential moving average as its basis. StockCharts documents both histories and gives 20 EMA, 10 ATR, and a multiplier of 2 as its example defaults. Therefore, “Keltner Channel” names a family of related formulas rather than one immutable series. A historical article, chart, or backtest is reproducible only if it states which version and inputs it used. {source:stockChartsKeltnerChannels}
Calculate the band before interpreting a cross
Suppose a chosen basis is 100.00 and the matching ATR is 2.00. With multiplier k = 1.5, the upper band is 100 + 1.5 × 2 = 103 and the lower band is 100 − 3 = 97. If only k changes to 2, the lines move to 104 and 96; neither the average nor volatility estimate changed. A completed close of 103.40 is above the first upper band but below the second. This is a threshold comparison, not evidence that one setting is better. For a live decision, compare with the band value available at the rule’s actual decision time; a still-forming bar can change its close, high, low, and ATR.
Use ATR to measure width, not direction
Average True Range measures range, not up-versus-down direction. True range for a bar is the greatest of its high minus low, the absolute distance from its high to the prior close, and the absolute distance from its low to the prior close. The prior-close terms let a gap contribute to the range. ATR then smooths those observations; TradingView’s ATR documentation describes Wilder’s running average as the default and also lists simple, exponential, and weighted alternatives. A wider ATR expands both sides of a symmetric channel even when price is falling. ATR is backward-looking and smoothed, so an abrupt volatility change enters gradually and a quiet period can keep width compressed. {source:tradingViewAverageTrueRangeSupport}
Read a band cross in its market regime
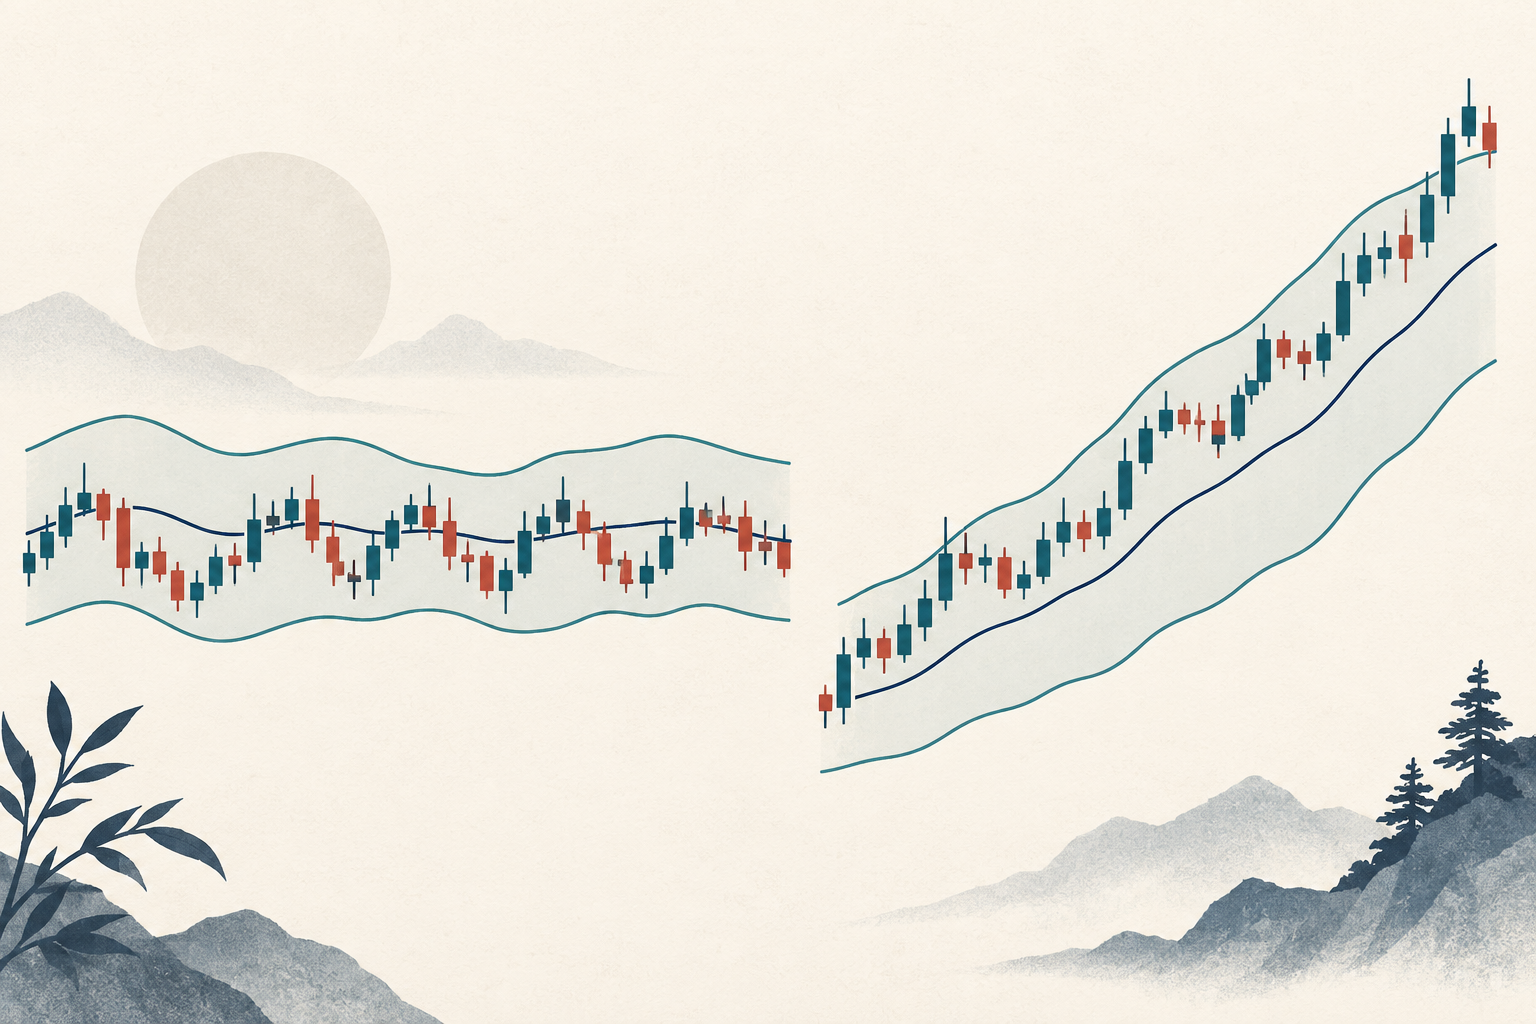
A close above the upper envelope can reflect persistent directional demand when price is advancing and the basis is rising. In a sideways market, the same close may be a temporary extension that later returns toward the basis. A close below the lower line has the mirrored ambiguity. TradingView’s example strategy enters long on an upper-band cross and short on a lower-band cross, but that is one mechanical rule, not a universal interpretation or evidence of profitability. Another trader may use a close beyond the band as a filter, wait for a retest, or take no trade. Define the market regime and the next action separately from the indicator event. {source:tradingViewKeltnerChannelsStrategy}
Use slope and width as context, not a forecast
The basis slope can summarize the recent direction of its chosen average; channel width can summarize the scale of recent movement. A rising basis with expanding bands describes a different recent path from a flat basis with narrow bands, but neither combination determines what comes next. Width can grow because gaps or large bars raise true range, not because the market has chosen a direction. Avoid turning “the price touched a band” into “the market is overbought” without a separately specified rule. If you normalize width by the basis, record the formula and handle a near-zero denominator; the raw distance is in price units and cannot be compared directly across differently priced instruments.
Record the platform and data conventions
Settings that look like small implementation details can produce different lines. One documented StockCharts default is 20-period EMA, 10-period ATR, and multiplier 2; cTrader documents a 20-period simple moving average, a 10-period simple ATR, and multiplier 2. Those defaults are not interchangeable, because an EMA reacts differently from an SMA and ATR smoothing also changes. Platforms may additionally choose close or typical price for the basis, define the session and bar close differently, or calculate a higher-timeframe band from an unfinished bar. cTrader’s reference makes its distinct average choices explicit. Record the symbol, venue, timeframe, session, basis source and average, ATR length and smoothing, multiplier, warm-up history, and whether the current bar is complete. {source:cTraderKeltnerChannels}
Test a complete rule rather than a channel line
A channel crossing does not specify an order, exit, position size, or acceptable loss. Write down whether the signal uses a high, low, or completed close; which band snapshot it compares with; when an order can be submitted; and what happens after a gap or a second signal. Separate the indicator threshold from the trigger and fill price. Then test the full rule with spread, commissions, slippage, market hours, and realistic order behavior, using chronological holdout data or walk-forward evaluation rather than choosing settings on the same history used to report results. A channel can organize observations; it does not establish an edge or guarantee a fill.
Common questions
Q1Are Keltner Channels the same as Bollinger Bands?
No. A common Keltner version offsets a moving average by a multiple of ATR, while Bollinger Bands use a standard-deviation measure around a moving average. Their widths respond to different calculations.
Q2Is a close outside a Keltner band automatically a reversal signal?
No. A band cross may accompany continued movement in a trend or a temporary extension in a range. The indicator does not choose the regime or the next action.
Q3Why does my platform show different Keltner lines?
Platforms can vary the original versus modern formula, basis source and average, ATR period and smoothing, multiplier, session, and bar timing. Compare every input before comparing values.
Sources and further reading
Report an issue
We’ll prepare an email with this article link. Mark receives the report only after you send it
Quick check
Read the guide? Check yourself with 3 questions
Question 01
With basis 100, ATR 2, and multiplier 1.5, what is the upper band?
Choose an answer to see the explanation
Options glossary
Clear definitions of essential option terms, from calls, puts, and option chains to IV, Greeks, open interest, and max pain
Browse the options glossary