

ADX Trading Signals: Read Trend Strength and Direction Separately
Learn what ADX measures, how +DI and −DI indicate direction, why 20 and 25 are reference levels rather than rules, and how to test an ADX filter
In this guideADX measures strength, not up or down
Short summary
ADX measures the strength of directional movement after smoothing; it does not say whether price is rising or falling. The +DI and −DI lines provide that directional comparison. Keep the three readings separate, treat common 20 and 25 levels as conventions, and define a price-based trigger and risk plan before turning the indicator into a trade.
ADX measures strength, not up or down
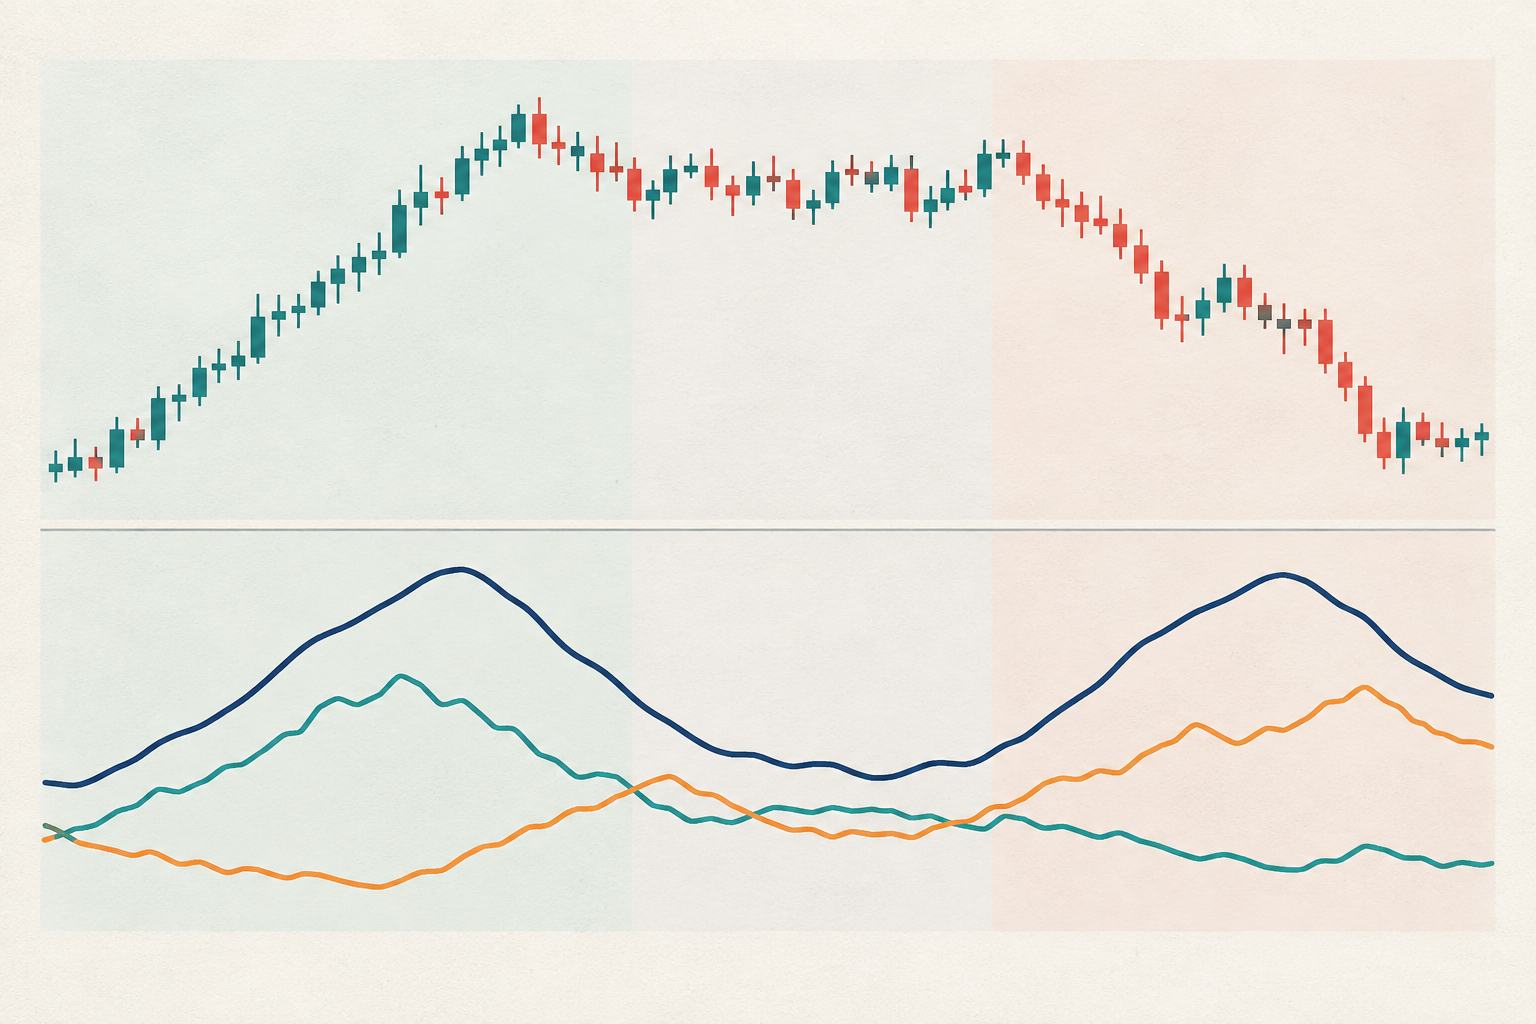
The Average Directional Index (ADX) is the smoothed final line in Wilder’s Directional Movement system. It summarizes how separated the positive and negative directional indicators have been. The value is conventionally shown on a 0–100 scale: a higher reading means stronger directional movement under that calculation, not a more bullish market, a higher probability of profit, or a larger expected return. ADX can be high while price falls if −DI is leading.
The Directional Movement Index (DMI) combines ADX with +DI and −DI. Read ADX for strength and compare the two DI lines for direction. If a chart displays only ADX, it cannot tell you which side is leading. TradingView describes the same division between ADX strength and DI direction {source:tradingViewDirectionalMovement}. Neither component alone predicts what the next bar will do.
Build the index from directional movement and true range
For each completed bar, compare its high and low with the previous bar. Let UpMove = High[t] − High[t−1] and DownMove = Low[t−1] − Low[t]. If UpMove is positive and larger than DownMove, +DM = UpMove and −DM = 0. If DownMove is positive and larger than UpMove, −DM = DownMove and +DM = 0. If neither wins, both directional movements are zero. This rule keeps one bar from counting both an upward and downward expansion as dominant movement.
True range (TR) is the greatest of High[t] − Low[t], |High[t] − Close[t−1]|, and |Low[t] − Close[t−1]|. Wilder smoothing is then applied to +DM, −DM, and TR. With period n, the smoothed sum updates as prior smoothed sum − prior smoothed sum ÷ n + current value. The directional indicators are +DI = 100 × smoothed +DM ÷ smoothed TR and −DI = 100 × smoothed −DM ÷ smoothed TR. TradingView’s calculation guide describes these inputs and the subsequent smoothing steps {source:tradingViewAverageDirectionalIndex}.
Next calculate DX = 100 × |+DI − −DI| ÷ (+DI + −DI), then smooth the DX values to form ADX. For Wilder’s 14-bar recurrence, ADX[t] = (13 × ADX[t−1] + DX[t]) ÷ 14 after initialization. This staged calculation explains why ADX reacts more slowly than the DI lines. TA-Lib documents the Wilder smoothing, the 0–100 output, and the fact that the result measures trend strength regardless of direction {source:taLibAverageDirectionalIndex}. Implementations can differ in initialization and warm-up history, so compare settings before expecting identical plotted values.
Read the level and slope as different pieces of information
A level and a slope answer different questions. An ADX value of 27 describes the calculated strength at that bar. A rising ADX says that the smoothed DX balance has recently increased; it does not say price is accelerating, that a breakout will continue, or that the move is upward. A falling ADX says measured strength is easing, but price can still be moving directionally. Use +DI versus −DI for the directional comparison and price structure for context.
The often-quoted 20 and 25 levels are reference conventions associated with Wilder’s framework. Some traders treat readings below 20 as weak or range-like and readings above 25 as evidence of a stronger trend, leaving 20–25 as a transition area. They are not universal cutoffs. Volatility, bar interval, asset, session, and smoothing affect the series. TradingView explicitly notes that acceptable values depend on the instrument and the analyst’s interpretation {source:tradingViewDirectionalMovement}. If you use a threshold, select it before evaluating results and test it on the market and timeframe you actually intend to study.
Work through a numerical example before using a threshold
Suppose +DI is 32 and −DI is 14. The directional spread is 18 and their sum is 46, so DX is 100 × 18 ÷ 46, or about 39.13. That DX value describes separation between the two DI lines on this bar; it is not the ADX reading yet. ADX averages DX over time.
If the prior 14-period ADX is 24 and the current DX is 39.13, the Wilder update is (13 × 24 + 39.13) ÷ 14, or about 25.08. ADX crosses 25 in this hypothetical example, but the calculation does not establish an entry or forecast. Reverse the DI values to +DI 14 and −DI 32 and DX remains 39.13: the strength calculation is the same even though the negative side leads. This symmetry is the easiest check that ADX itself has no direction.
Use ADX as a filter around a separate price trigger
One disciplined use is to make ADX a predeclared regime filter around an independent price setup. For example, a ruleset could require a completed-bar ADX above a chosen level, then require +DI above −DI for a long-side setup or the reverse for a short-side setup. The actual entry could still require a separately defined pullback, range break, or close through a price level. State whether the filter must already be true before the trigger or may become true on the same bar.
A filter can reduce the number of candidate trades, but that does not make the remaining trades better. A high ADX may confirm strength only after much of a move has happened; a low reading can exclude an early move. Compare the filtered rule with the identical rule without the filter, using the same dates, execution assumptions, and costs. Do not use ADX to replace an entry, invalidation, stop distance, exit, or position-size rule.
Treat a DI crossover as a condition, not a complete entry
A +DI/−DI crossover is a relative change in the smoothed directional measures. A bullish interpretation is often assigned when +DI crosses above −DI; the reverse is often called bearish. Crossovers can cluster in sideways conditions, and a crossover does not prove that price has started a durable trend. The confirmation rule matters: an intrabar cross can disappear before the bar closes.
The ADX line can remain elevated from the previous move when the DI lines cross. If −DI had led during a decline and +DI then moves above it, a high ADX still describes the recent strength of directional movement, not confirmation that the new upward move is already strong. Define whether you require a close-confirmed cross, a minimum DI separation, an ADX level or slope, and a price event. Avoid choosing those conditions after inspecting which version best fits the past chart.
Freeze the period, bars, and calculation convention
A period of 14 means 14 bars, not automatically 14 calendar days. Fourteen five-minute bars, fourteen daily bars, and fourteen futures-session bars use different data and answer different questions. ADX normally uses high, low, and close, so session boundaries, missing bars, adjusted prices, and the chosen symbol can change inputs. The value on an unfinished bar may also move as its high, low, and close develop.
Record the symbol and venue, bar interval, session template, period, smoothing method, source fields, warm-up history, and whether signals are read intrabar or at a completed close. Different platforms may seed the first smoothed values differently, apply an additional smoothing period, or label a single ADX plot separately from a three-line DMI display. TA-Lib’s documentation lists its 14-period default and initialization behavior; those are implementation details, not a universal trading setting {source:taLibAverageDirectionalIndex}. Match the data and settings before diagnosing a disagreement.
Test the complete rule and keep position risk separate
Write the whole hypothesis before testing: the price setup, DI condition, ADX level or slope, bar-close timing, order type, invalidation, exit, and position sizing. Model the next executable price rather than assuming that a completed-bar signal can fill at the same close. Include spread, commissions, slippage, and gaps. Keep a fixed risk budget and calculate quantity from a separate stop distance; ADX does not measure how much the position can lose.
Compare a baseline rule, the ADX-filtered variant, and reasonable nearby thresholds on a chronological holdout or a walk-forward validation. If many periods or cutoffs were tried, record the full search. An indicator filter that looks compelling only at one chosen setting may be a product of selection. For adjacent techniques, see Donchian breakout timing, RSI regime context, and ATR stop distance. Historical results are conditional on the tested instrument, period, implementation, and costs; they do not establish future performance.
Common questions
Q1Does ADX above 25 mean I should buy?
No. It is a commonly used strength reference, not a buy instruction. Check +DI and −DI for directional context and define a separate price trigger and risk plan.
Q2Can ADX rise while price is falling?
Yes. ADX measures the strength of directional movement without assigning an up or down sign. −DI may lead while ADX rises.
Q3Is a DI crossover a complete trading signal?
No. Decide whether the cross must hold at bar close, what price event confirms it, where the idea is invalidated, and how the position is sized.
Sources and further reading
Report an issue
We’ll prepare an email with this article link. Mark receives the report only after you send it
Quick check
Read the guide? Check yourself with 3 questions
Question 01
ADX is 31 and −DI is above +DI. Which reading is supported?
Choose an answer to see the explanation
Options glossary
Clear definitions of essential option terms, from calls, puts, and option chains to IV, Greeks, open interest, and max pain
Browse the options glossary