

Regression Stability और Structural Change के लिए CUSUM Test
जानें कि recursive residuals regression CUSUM path कैसे बनाते हैं, boundaries क्या जाँचती हैं, और Chow test, CUSUM of squares तथा real-time monitoring से इसका क्या अंतर है
इस गाइड मेंRegression CUSUM test क्या पूछता है
संक्षिप्त सारांश
Regression CUSUM test समय-क्रम में एक कदम आगे के recursive residuals जोड़ता है और जाँचता है कि उनका cumulative path coefficient stability model के अनुरूप है या नहीं। Boundary पार होना, निर्दिष्ट model और उसकी assumptions के तहत स्थिर coefficients के विरुद्ध evidence है; इससे कारण, एकमात्र break date या trading opportunity तय नहीं होती।
Regression CUSUM test क्या पूछता है
पूरे sample पर regression उचित दिख सकता है, फिर भी बीच में उसका संबंध बदल गया हो। एक अवधि के positive prediction errors और बाद के negative errors सामान्य full-sample summary में एक-दूसरे को काट सकते हैं। Regression CUSUM समय का क्रम बनाए रखता है: यह recursive prediction errors जमा करता है और देखता है कि coefficient स्थिर होने पर अपेक्षित path से वह कितना दूर जाता है।
Brown, Durbin और Evans ने recursive residuals पर आधारित regression-stability tools विकसित किए, जिनमें CUSUM और CUSUM of squares शामिल हैं। ये tests model assumptions के तहत जाँचते हैं कि sample भर regression relationship स्थिर रहने की धारणा से मेल खाता है या नहीं। ये बदलाव का कारण नहीं बताते और उस industrial process-control CUSUM rule से अलग हैं जो अलग से चुने target mean से deviations जोड़ता है।
यह guide Brown–Durbin–Evans regression CUSUM पर केंद्रित है। Software “CUSUM” नाम कई statistics के लिए इस्तेमाल कर सकता है, इसलिए report में केवल label नहीं, residual sequence, scaling, boundaries और reference distribution भी बताएँ।
भविष्य के observations का उपयोग किए बिना recursive residuals बनाएँ
Regression को \(y_t=x_t'\beta+u_t\) लिखें। यदि model में intercept है, तो \(x_t\) में intercept भी शामिल है और \(k\) coefficients की संख्या है। शुरुआत में इतने observations लें कि model estimate हो सके और design matrix full column rank हो। उसके बाद हर observation के लिए केवल \(t-1\) तक के data से regression fit करें और \(y_t\) predict करें।
यदि \(X_{t-1}\) में पिछली observation तक के regressors हैं, तो recursive residual है
\[ w_t=\frac{y_t-x_t'\hat\beta_{t-1}}{\sqrt{1+x_t'(X_{t-1}'X_{t-1})^{-1}x_t}},\qquad t=k+1,\ldots,T. \]
Numerator one-step prediction error है। Denominator \(x_t\) के leverage पर निर्भर prediction uncertainty को adjust करता है; यह अपने-आप market volatility का estimate नहीं है। उपयुक्त fixed regressors और independent, समान-variance errors वाले classical stable linear model में recursive residuals का mean शून्य, वे परस्पर uncorrelated और उनका error variance समान होता है। इन्हीं गुणों से residuals जोड़ने का आधार मिलता है। केवल least squares से regression estimate करने पर ये गुण सुनिश्चित नहीं होते।
Initial observations coefficients तय करते हैं; वे इस recursion से निकले sample-out residuals की sequence नहीं हैं। यदि initial design matrix लगभग singular है, तो आगे के predictions भी अस्थिर हो सकते हैं। Initial sample, regressors और transformations बताएँ, क्योंकि हर चुनाव residual path और test के प्रश्न को बदलता है।
Signed errors जोड़ें और path को test boundaries से मिलाएँ
चुने हुए implementation में इस्तेमाल scale estimate को \(\hat\sigma\) कहें। Observation \(r\) तक cumulative path लिखा जा सकता है:
\[ C_r=\frac{1}{\hat\sigma}\sum_{t=k+1}^{r}w_t. \]
Stability null के तहत sampling variation के अलावा positive और negative innovations संतुलित होने चाहिए। Plot किए path की तुलना test null distribution से निकली critical boundaries से करें। Boundary पार हो तो assumptions लागू होने की शर्त पर चुने significance level पर parameter constancy reject होती है। अलग implementations में scaling और boundary construction अलग हो सकती है; हाथ से बनाई fixed band संबंधित critical values का विकल्प नहीं है।
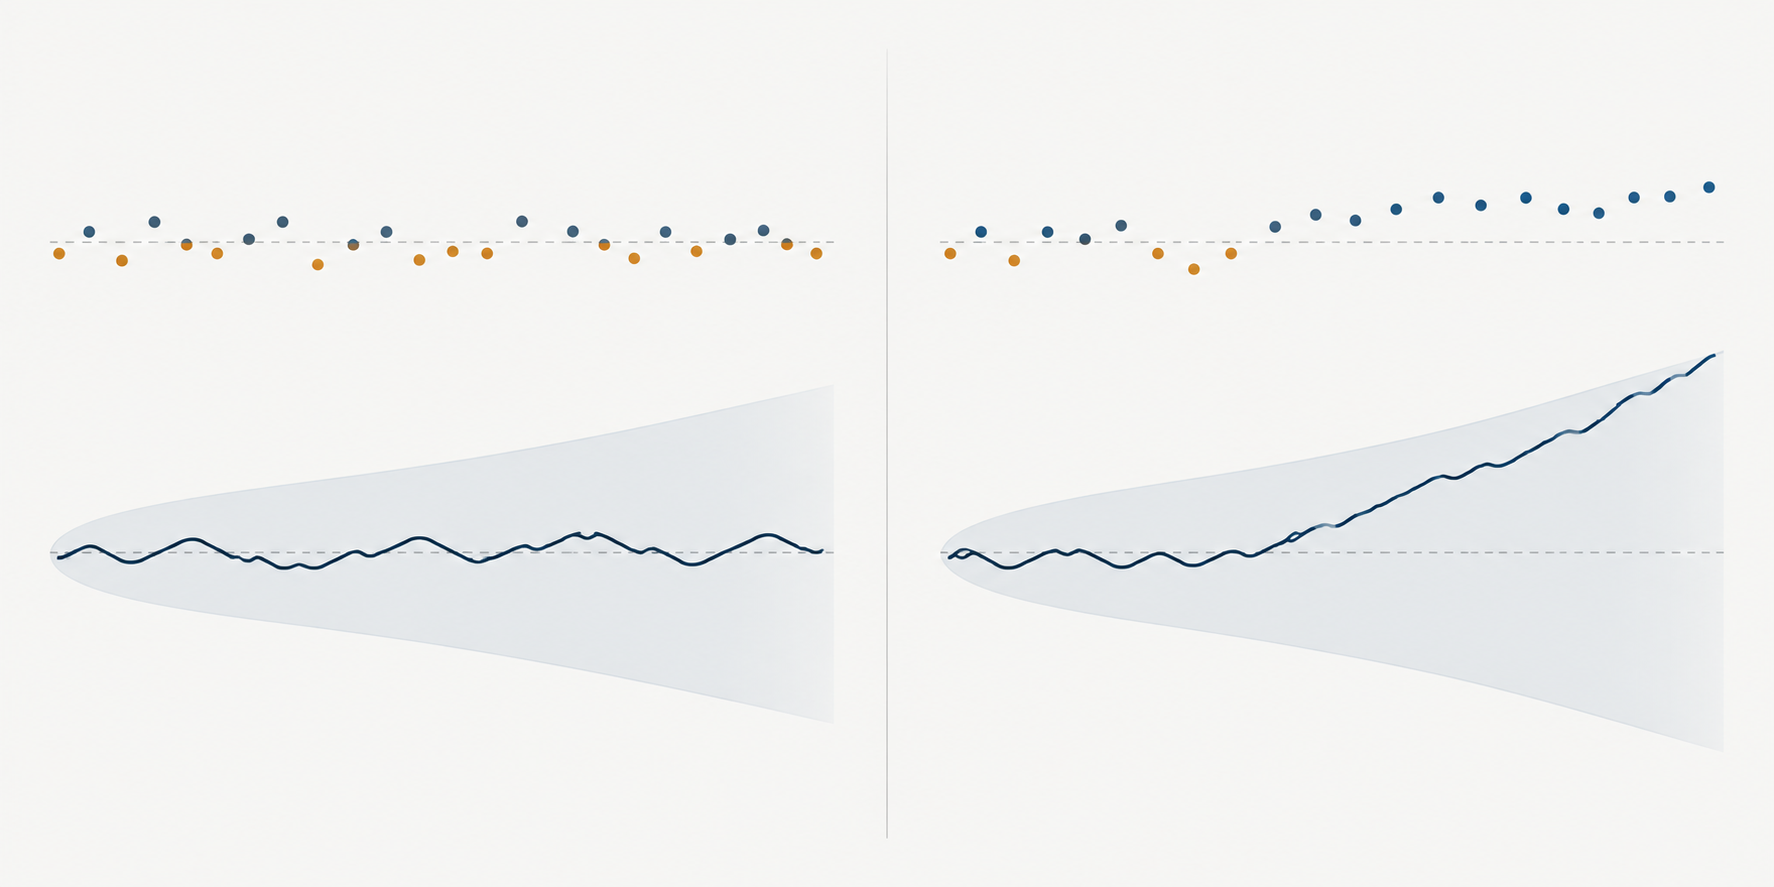
Path की दिशा pattern समझने में मदद करती है। Positive recursive errors लगातार आएँ तो observed outcome बार-बार prior fitted value से ऊपर होता है और sum चढ़ता है। लगातार negative errors उसे नीचे ले जाते हैं। बारी-बारी के errors path को पुराने स्तर के पास रख सकते हैं, भले individual residuals छोटे न हों। इसलिए CUSUM prediction errors की magnitude और उनका क्रम, दोनों उपयोग करता है।
बाकी स्थितियाँ समान हों तो intercept में बदलाव अक्सर एक ही दिशा के residuals पैदा करता है। Slope बदलने पर \(x_t\) की स्थिति और sign के अनुसार prediction errors की दिशा अलग हो सकती है। यदि regressor अपने mean के आसपास बदलता रहे, तो वास्तविक slope change के बावजूद एक cumulative path में कुछ errors कट सकते हैं। इसलिए boundary के अंदर path होना सभी regression coefficients के स्थिर रहने का प्रमाण नहीं है। Recursive coefficient paths, interaction tests और test power भी देखें।
मान लें छह scale-adjusted recursive residuals लगातार \(+0.4\) हैं; cumulative बढ़त \(2.4\) होगी। Sequence \(+0.4,-0.4,+0.4,-0.4,+0.4,-0.4\) का अंतिम योग शून्य होगा। दोनों में residuals का absolute size समान है, लेकिन केवल पहली sequence एक दिशा में बनी रहती है। ये जोड़ केवल mechanism समझाते हैं; ये critical values, p-value या किसी वास्तविक asset का evidence नहीं हैं।
CUSUM of squares को अलग diagnostic की तरह पढ़ें
CUSUM of squares में signs के बजाय recursive residuals के squares जमा किए जाते हैं। Cumulative share का एक सरल रूप है:
\[ Q_r=\frac{\sum_{t=k+1}^{r}w_t^2}{\sum_{t=k+1}^{T}w_t^2}. \]
Stable, समान-variance error process में cumulative share observations की संख्या के लगभग अनुपात में बढ़ना चाहिए। बड़े squared residuals का झुंड path को तेज ढलान देता है; शांत अवधि में वह सपाट हो सकता है। Brown, Durbin और Evans इस विधि को signed CUSUM के साथ चर्चा करते हैं, और बाद के काम में ordinary least-squares residuals पर आधारित CUSUM-of-squares tests का अध्ययन हुआ।
Squared-residual path को pure volatility test या coefficient-change का स्पष्ट विकल्प न समझें। बड़े observations, variance shift, गलत conditional mean specification और बदलते regression coefficients सभी इसे प्रभावित कर सकते हैं। दूसरी ओर, positive और negative errors संतुलित रहने पर भी variance बदलने से signed CUSUM की reference distribution गलत हो सकती है। ARCH-LM test squared residuals की predictability पर अधिक विशिष्ट प्रश्न पूछता है; वह भी हर volatility pattern का निदान नहीं करता।
Break के प्रश्न से मेल खाता statistic चुनें
Fixed-date Chow test पहले से तय तारीख के दोनों ओर regression coefficients की तुलना करता है। Regression CUSUM समय-क्रम वाले recursive path की जाँच करता है और किसी बाहरी रूप से तय break date की माँग नहीं करता। Boundary पार होने से यह सटीक तारीख नहीं मिलती कि एक abrupt change कब शुरू हुआ। Gradual drift, कई बदलाव, outliers की sequence या variance-model failure अलग-अलग path बना सकते हैं।
जब change date अज्ञात हो और उद्देश्य एक break का formal test हो, Andrews supremum Wald, likelihood-ratio और Lagrange-multiplier procedures देते हैं। वे candidate dates खोजते हैं और उस search को ध्यान में रखने वाले nonstandard critical values इस्तेमाल करते हैं। उनके statistics और critical values Brown–Durbin–Evans CUSUM bands के बदले इस्तेमाल नहीं किए जा सकते। Multiple breaks के लिए अलग procedures और assumptions चाहिए। पहले से तय तारीख की तुलना के लिए Chow test guide और व्यापक search question के लिए Andrews का unknown-change-point paper देखें।
जब analyst अनेक diagnostics चलाता है, यह अंतर मायने रखता है। CUSUM, CUSUM of squares, candidate dates, regressors और sample windows बार-बार आज़माने से selection problem पैदा होती है। एक prespecified test का nominal level उन सभी कोशिशों में कम-से-कम एक false alarm की संभावना नहीं बताता। परिणाम देखने से पहले तय करें कि कौन-सा path या statistic देखेंगे, या search को ध्यान में रखने वाली inference procedure अपनाएँ।
Retrospective test और live stability monitoring अलग रखें
Retrospective test एक fixed historical sample का मूल्यांकन करता है। Monitoring rule baseline period के बाद आने वाले नए data को बार-बार जाँचता है। हर नई observation पर one-shot boundary लगाने से nominal false-alarm rate अपने-आप बरकरार नहीं रहती; लगातार निर्णयों की probability structure अलग होती है।
Chu, Stinchcombe और White ऐतिहासिक sample से stable relationship estimate करने के बाद real-time monitoring के लिए fluctuation और CUSUM procedures विकसित करते हैं। उनके paper की asymptotic conditions के तहत monitoring boundaries बार-बार देखने को ध्यान में रखती हैं। Baseline खुद उपयुक्त होना चाहिए और monitoring design में alert के बाद की कार्रवाई, parameter updates और monitoring की अवधि तय करनी चाहिए। इन विकल्पों के बिना historical regression CUSUM chart को online procedure नहीं कहना चाहिए।
Trading system में alert का अर्थ है कि आने वाला data model relationship से इतना अलग हो सकता है कि stability assumption पर फिर विचार करना चाहिए। यह investigation या पहले से तय risk review शुरू कर सकता है। यह नहीं बताता कि कौन-सा coefficient बदला, trade लेना चाहिए या exposure घटाने से returns सुधरेंगे। Repeated monitoring हो तो statistical threshold के साथ detection delay और false-alert cost भी मापें।
Financial CUSUM path पढ़ने से पहले assumptions जाँचें
Classical recursive-residual derivation सही तरह निर्दिष्ट linear relationship, स्थिर error variance और serial correlation-विहीन error process मानती है। Financial time series volatility clustering, heavy tails, stale या asynchronous prices, overlapping return horizons और market-structure changes के कारण इन शर्तों का उल्लंघन कर सकती हैं। Residuals की एक दिशा में run वास्तविक coefficient shift, छूटी हुई dynamics, गलत timestamps या reference distribution बदलने वाले volatility episode से आ सकता है।
Ordinary least squares के बाद केवल covariance estimator बदलने से valid CUSUM boundaries नहीं मिलतीं। Heteroskedasticity या dependence-robust inference के लिए उन स्थितियों के अनुरूप statistic और reference distribution चाहिए। Regression CUSUM plot stability diagnostic है; यह residual dependence जाँचने, conditional heteroskedasticity test करने या specification validate करने का विकल्प नहीं। संबंधित प्रश्नों के लिए ARCH-LM volatility-clustering guide और robust standard errors guide देखें।
Residuals बनाने से पहले sampling interval और market calendar तय करें। लंबे holiday को पार करने वाला close-to-close return, सामान्य session return जितने अंतराल का नहीं होता। Corporate actions, contract rolls, currency conversion और missing observations भी ऐसे prediction errors पैदा कर सकते हैं जो instability जैसे दिखें। यह बताए बिना gaps भरें या assets align न करें कि model में समय \(t\) का observation क्या दर्शाता है।
Test दोहराने के लिए पर्याप्त विवरण दें
Outcome, regressors, intercept, transformations, sample dates, frequency, initial estimation period और recursive residuals की संख्या बताएँ। लिखें कि residuals को recursive prediction variance से scale किया था या नहीं और \(\hat\sigma\) कैसे estimate किया। CUSUM या CUSUM of squares का version, reference distribution, critical level, boundary rule और नतीजे पर असर डालने वाले software defaults स्पष्ट करें।
Path या statistic को fitted coefficients और residual diagnostics के साथ दिखाएँ। Boundary पार होना tested model के तहत constancy के खिलाफ evidence है, economic cause या किसी नामित घटना के causal effect का estimate नहीं। Forecasting या trading उद्देश्य हो तो chronological holdouts लें, बताएँ कि alert कब उपलब्ध होता, और spread, market impact, fees, borrow, financing तथा turnover शामिल करें। Response को fixed-model benchmark से तुलना करें। Stability warning model की समीक्षा करा सकती है; adaptive rule का edge साबित नहीं करती।
Brown, Durbin और Evans ने 1975 paper में recursive-residual CUSUM और CUSUM-of-squares stability procedures प्रस्तुत किए। McCabe और Harrison ने ordinary least-squares residuals से CUSUM-of-squares test का अध्ययन किया। Unknown change points के लिए Andrews (1993), sequential monitoring के लिए Chu, Stinchcombe और White (1996) देखें। संबंधित guides में OLS regression, Chow test और volatility clustering शामिल हैं।
आम सवाल
Q1क्या CUSUM test structural-break की सटीक तारीख पहचानता है?
नहीं। Path दिखा सकता है कि cumulative prediction errors कब लगातार खिसकने लगे, लेकिन boundary crossing एक unique break date का formal estimate नहीं है। Unknown-date procedures अपनी search statistics और critical values इस्तेमाल करते हैं।
Q2क्या CUSUM of squares, volatility-clustering test के समान है?
नहीं। यह recursive residual squares का cumulative share track करता है और कई तरह की misspecification या instability पर प्रतिक्रिया दे सकता है। ARCH-LM test अपनी assumptions के तहत squared residuals की serial predictability पर केंद्रित है।
Q3क्या historical CUSUM boundary को हर दिन live alerts के लिए दोहरा सकता हूँ?
अपने-आप नहीं। नई observations पर बार-बार test करने से false-alert behavior बदलता है। Sequential monitoring में repeated looks के लिए बनाई गई boundaries और परिभाषित stable baseline चाहिए। ---
स्रोत और आगे पढ़ें
समस्या की रिपोर्ट करें
हम इस लेख का लिंक जोड़कर ईमेल तैयार करेंगे। भेजने के बाद ही Mark को आपकी रिपोर्ट मिलेगी
त्वरित जाँच
गाइड पढ़ने के बाद 3 सवालों से खुद को जाँचें
सवाल 01
Regression CUSUM recursive residuals का उपयोग क्यों करता है?
व्याख्या देखने के लिए एक उत्तर चुनें
विकल्प शब्दावली
Variation in the conditional error variance across regressor values or states, invalidating an equal-variance covariance formula.
विस्तृत गाइड पढ़ेंCausationA relationship describing how an outcome would differ under a specified intervention or counterfactual change; observed association alone does not identify it.
विस्तृत गाइड पढ़ेंMulticollinearityStrong linear dependence among included regressors that makes their separate coefficients imprecise and sensitive to the sample.
विस्तृत गाइड पढ़ें