

Bollinger Bands: Read %B and BandWidth Without Treating a Squeeze as a Signal
Calculate Bollinger %B and BandWidth, compare compression within a market, and separate a squeeze setup from a directional trading rule
In this guideRead the bands as relative locations
Short summary
Bollinger Bands turn a moving average and a dispersion measure into a price envelope. Two derived values answer different questions: %B says where price sits between or beyond the bands, while BandWidth says how wide the envelope is relative to its center. Learn to calculate both, compare width with the same market’s history, and treat a squeeze as a state to investigate rather than a forecast of direction.
Read the bands as relative locations
The upper and lower Bollinger Bands describe price relative to a selected moving average and recent dispersion. A close near the upper band is high relative to that rolling reference; a close near the lower band is low. Neither location is a fixed valuation, a forecast, or a probability that price will reverse. Because the reference window moves, the bands can shift even when today’s price barely changes. A band touch is an observation to interpret with the trend, bar timing, and the rule being tested, not a complete buy or sell instruction. The original rules explicitly warn that a tag alone is not a signal and that price can walk a band in a strong trend. {source:johnBollingerBandsRules}
Rebuild the envelope from its inputs
A common construction uses a 20-period simple moving average as the middle band and places the outer bands two standard deviations above and below it. In notation, Basis = MA(source, n), Upper = Basis + k × σ, and Lower = Basis − k × σ, where n is the window, k is the multiplier, and σ is the dispersion of the chosen source over that window. The familiar 20 and 2 are defaults, not universal settings. Source, basis type, timeframe, window, multiplier, and any plotted offset all affect what a chart shows. Match these inputs before comparing two platforms or copying a signal into a script. {source:tradingViewBollingerBandsGuide}
Use %B to quantify price position
%B converts the current price’s location into a scale tied to the current bands: %B = (Price − Lower) / (Upper − Lower). At 0, price is on the lower band; at 0.5, it is at the midpoint when the bands are symmetric around the basis; at 1, it is on the upper band. A value below 0 or above 1 means price is outside the envelope. It is a normalized location, not a percentile of future outcomes. The commonly displayed 0.2 and 0.8 levels are reference conventions, so write down whether your rule uses an intrabar touch, a bar close, or a confirmed cross. {source:tradingViewBollingerPercentB}
Use BandWidth to measure compression
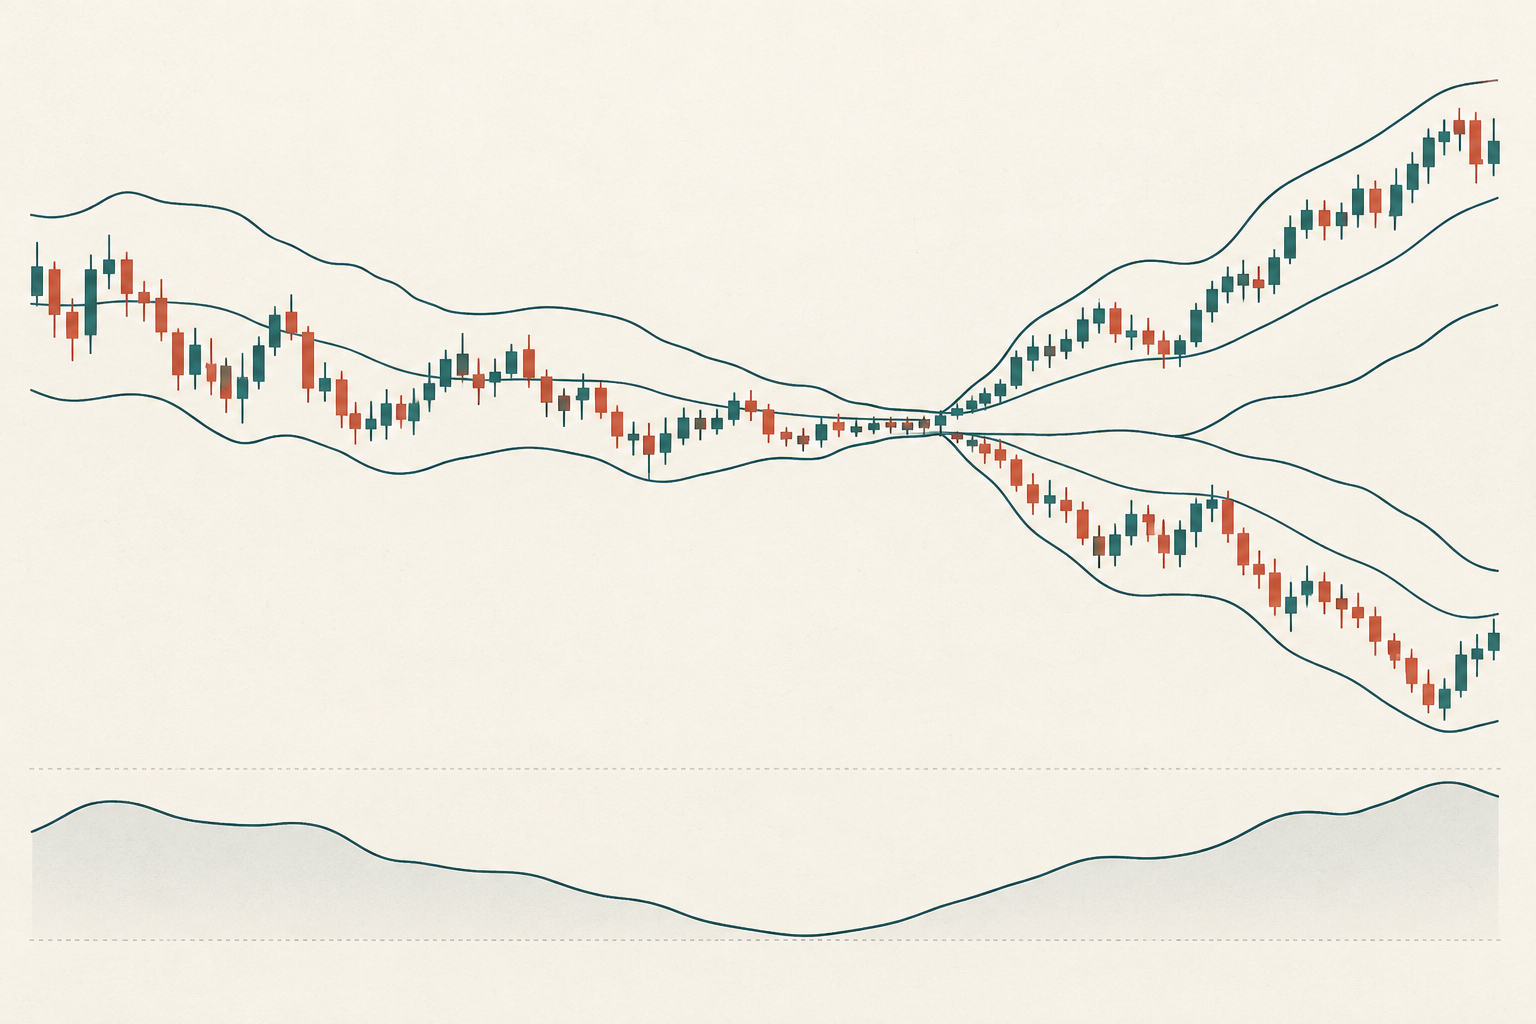
BandWidth rescales the distance between the outer lines by the middle band: BandWidth = 100 × (Upper − Lower) / Basis. It is often displayed as a percentage. When the basis is positive, a falling value means the envelope has narrowed relative to that basis; rising dispersion usually widens it. A small raw distance and a small BandWidth are not the same description across different price levels. The denominator also matters: if the basis is zero the ratio is undefined, and a zero or negative basis needs a separately chosen interpretation rather than an automatic percentage comparison. BandWidth measures compression, not the cause or direction of a later move. {source:tradingViewBollingerBandWidth}
Use this invented five-close snapshot to see both derived measures. The closes are 97, 99, 100, 101, and 103. Their five-value mean is 100; using the population-divisor convention for this illustration, the standard deviation is sqrt((9 + 1 + 0 + 1 + 9) / 5) = 2. With k = 2, the bands are 104 and 96. At price 103, %B = (103 − 96) / (104 − 96) = 0.875, while BandWidth = 100 × 8 / 100 = 8%. A price of 105 would put %B at 1.125, outside the upper band; it would not mean a 112.5% chance of anything. This five-point arithmetic example is not the default 20-period chart setting, and a platform comparison still requires matching its standard-deviation and basis conventions.
<!-- learn:figure -->
Compare a squeeze with that market’s history
A squeeze label needs a comparison window. An 8% BandWidth reading could be near a six-month low for one instrument and ordinary for another, even on the same chart interval. TradingView likewise cautions that narrowness depends on both the instrument and timeframe, and points readers to past BandWidth and price behavior. Choose the lookback, use completed observations, and define the threshold before looking at outcomes. For example, a study could flag readings below the instrument’s own 10th percentile over the previous 125 completed bars. That is one research definition, not an official default or a promise that expansion must follow. {source:tradingViewBollingerBandWidth}
Wait for a separate direction rule
Compression does not say whether a later break will be upward or downward. A practical rule can separate an alert from a trigger: first mark a predeclared low-width condition, then wait for a distinct price event such as a completed close beyond a specified band, and finally define when an order could be sent. The 125-bar window and 10th-percentile threshold above are hypothetical inputs only. Test alternatives on earlier data without choosing the window after seeing which one produced the most attractive breakout. A squeeze can persist, and a first break can fail or reverse; the setup alone is not an entry.
Read band breaks inside the trend
A close outside a band is not automatically an overbought sell or oversold buy. In a persistent move, price may repeatedly touch or close beyond the upper band while the trend continues; the mirror image can occur below the lower band. John Bollinger’s rules describe those closes as initially more consistent with continuation than reversal, while still requiring a separate interpretation. If a reversal rule uses %B, specify the additional evidence that distinguishes a reversal from band-walking, such as a predeclared trend filter or a later price structure. Do not count several correlated indicators as independent confirmation merely because they have different names. {source:johnBollingerBandsRules}
Freeze the settings before testing
Record the source, basis type, lookback, multiplier, timeframe, session, price adjustment, offset, squeeze threshold, and whether the current bar is complete. If the signal uses the current bar’s close and current bands, the close also contributes to the rolling mean and dispersion. If the intended boundary must have been known before the bar began, compare against the prior completed band instead; these are different rules. Then state the order trigger, next available execution time, stop, position sizing, gap treatment, fees, and slippage assumptions using tradable prices. A chart condition and a simulated or live fill are separate parts of the process.
Common questions
Q1Do two-standard-deviation bands contain 95% of future prices?
No. The standard-deviation construction does not make Bollinger Bands a 95% confidence interval or probability forecast. Price observations are not independent normal draws, and the rules’ creator cautions against statistical assumptions from the band calculation.
Q2Does a Bollinger squeeze predict which way price will break?
No. BandWidth measures relative contraction. A separate, predeclared price trigger and direction rule are needed, and a breakout can fail.
Q3Is a close above the upper band automatically overbought?
No. The bands give a relative location. In a strong trend, price can walk the upper band, so a tag or close outside it is not by itself a reversal signal.
Sources and further reading
Report an issue
We’ll prepare an email with this article link. Mark receives the report only after you send it
Quick check
Read the guide? Check yourself with 3 questions
Question 01
With a lower band of 96, an upper band of 104, and a price of 103, what is %B?
Choose an answer to see the explanation
Options glossary
Clear definitions of essential option terms, from calls, puts, and option chains to IV, Greeks, open interest, and max pain
Browse the options glossary