

Event Studies and Cumulative Abnormal Returns (CAR)
Learn how financial event studies estimate abnormal returns, calculate CAR and CAAR, define event windows, and interpret the result without overstating causality.
In this guideWhat a financial event study measures
Short summary
A financial event study compares a security’s realized return around a dated event with a benchmark for its normal return. Abnormal return is realized minus expected return; cumulative abnormal return (CAR) is the arithmetic sum of abnormal returns across a chosen event window. CAR measures a model-relative price reaction, not automatically a causal effect or a tradable signal.
What a financial event study measures
A financial event study asks whether a stock moved differently from a specified normal-return benchmark around a defined event, such as an earnings release, merger announcement, dividend change, or regulatory decision. The main output is not the raw price move. It is the part of the return left after the chosen benchmark model has been applied.
For one security, an abnormal return (AR) is the realized return minus the estimated normal return on that session. CAR adds those daily abnormal returns across a stated interval. A positive CAR means the security outperformed the model’s benchmark over that interval; a negative CAR means it underperformed. Neither sign, by itself, says why the price moved.
This guide covers market reactions in financial returns. “Event study” also names panel-regression designs that plot treatment effects by time relative to an intervention. Those use different assumptions and estimands; the difference-in-differences event-time guide covers that design. A return event study is also not a complete causal design: other news can arrive in the same window.
Define the event and its tradable time
First specify what counts as the event, which firms or securities are in the sample, and how repeated or revised announcements are handled. Record the release timestamp in the exchange’s local time and map it to the trading session defined as t = 0 for daily data. For an after-close announcement, the next session may be t = 0, depending on the research question and return convention. State the exchange calendar and time zone.
An announcement after the closing bell cannot normally affect that session’s close-to-close return. For a daily-return study of the immediate response, the next trading session may be the appropriate t = 0. A pre-market release can affect the open-to-close or close-to-close return on the announcement date, depending on the return convention. The date printed on a press release is not enough to settle this choice.
Use consistent security and benchmark return series. State whether returns include distributions, how splits and delistings are handled, which currency is used, and how non-trading days or missing prices are treated. A price return for the stock compared with a total-return benchmark can create an avoidable mismatch.
Separate the estimation window from the event window
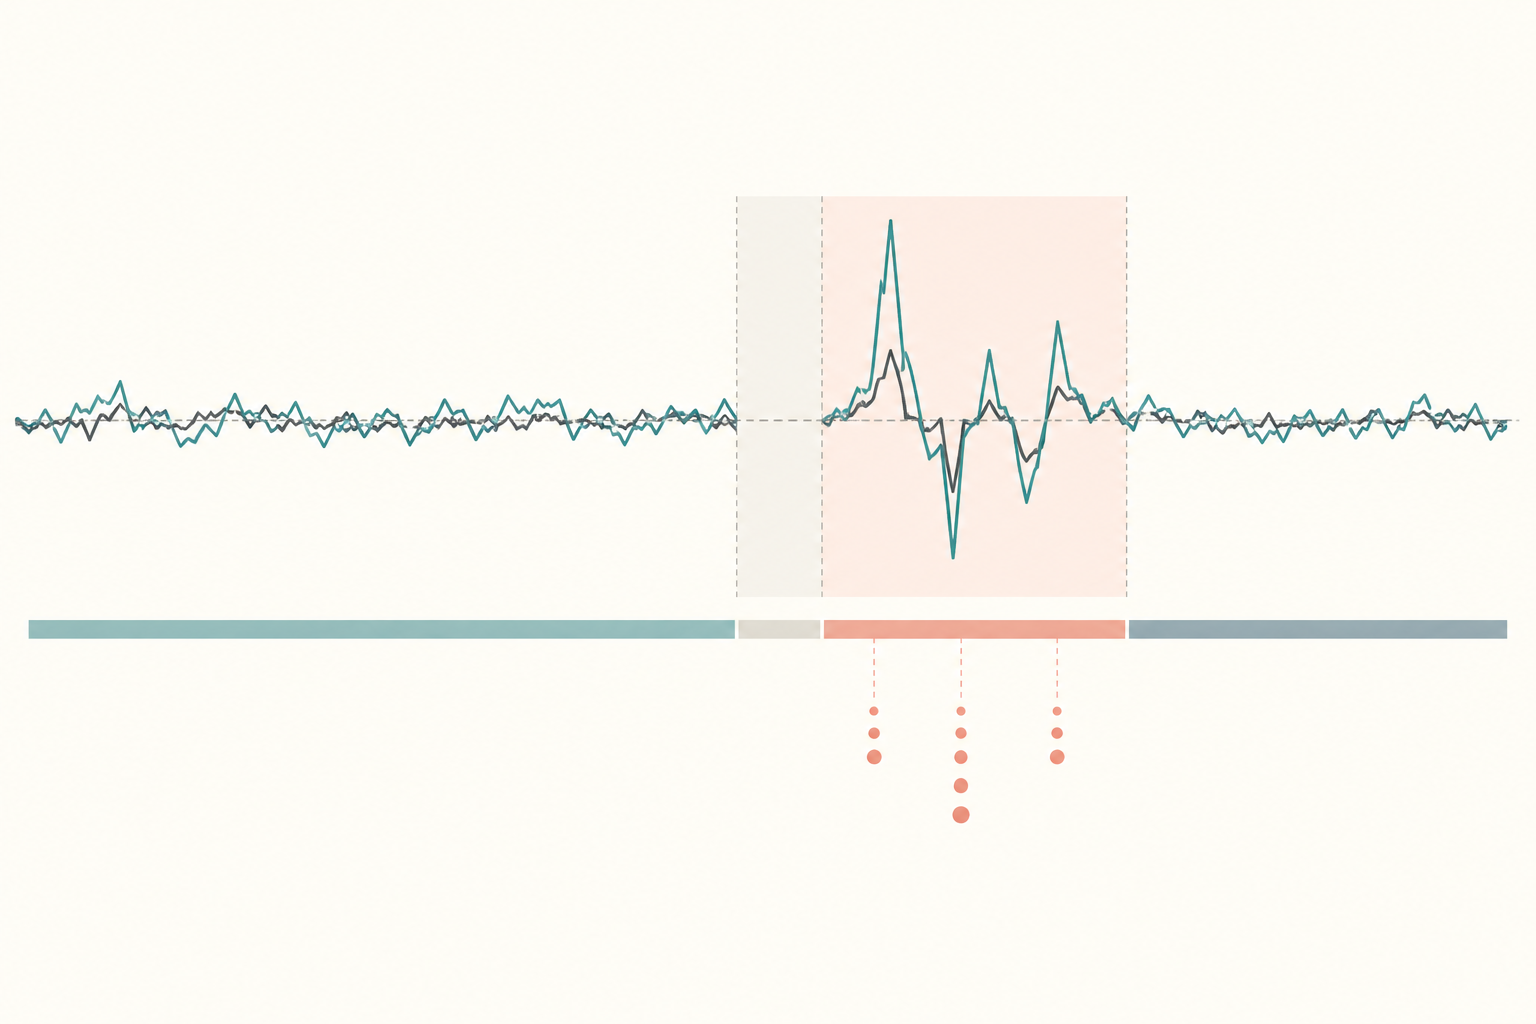
The estimation window supplies observations for fitting the expected-return model. The event window is the set of sessions whose ARs will be measured, often written [τ1, τ2] with t = 0 at the event. A common design keeps the windows apart so the event’s own returns do not pull the fitted benchmark toward the result being measured.
For example, a researcher might estimate a market model over sessions [-250, -30] and measure a short reaction over [-1, +1]. Those dates are only an illustration, not a universal recipe. A wider event window can capture leakage or delayed trading, but it also has more opportunity to include unrelated information. Choose the interval for the research question and specify it before inspecting which window produces the most attractive CAR.
The normal-return benchmark also matters. A constant-mean model, market-adjusted return, market model, or factor model can produce different expected returns. MacKinlay’s event-study review describes these model and window choices. A model fitted on the pre-event estimation window predicts a reference return; it does not observe the security’s unobservable no-event outcome.
Calculate abnormal returns and CAR
Under the market model, estimate the security’s relationship with a market index using only the estimation window:
R_i,t = α_i + β_i R_m,t + ε_i,t
Here R_i,t is the security return and R_m,t is the benchmark return. The fitted normal return in the event window is R̂_i,t = α̂_i + β̂_i R_m,t. Subtract it from the realized return to get AR_i,t = R_i,t - R̂_i,t.
For an event window from τ1 through τ2, define CAR_i[τ1,τ2] = Σ AR_i,t over those trading sessions. Keep the interval visible in the result: CAR[-1,+1] and CAR[0,+1] answer different timing questions. The sum is in percentage points when the inputs are daily percentage returns. Do not call it a compounded holding-period return.
The estimated coefficients, return convention, index, estimation dates, event-time mapping, and included observations are part of the calculation. If the market model is misspecified, the AR inherits that error. The OLS assumptions guide explains why residual behavior and the chosen regression sample matter.
Work through a hypothetical CAR calculation
Suppose a pre-event market-model fit gives α̂ = 0.10% and β̂ = 1.20. Consider three hypothetical sessions in [-1,+1]:
| Event time | Market return | Realized stock return | Fitted normal return | Abnormal return |
|---|---|---|---|---|
| -1 | 1.00% | 2.00% | 1.30% | +0.70 percentage points |
| 0 | -0.50% | -1.00% | -0.50% | -0.50 percentage points |
| +1 | 0.25% | 1.10% | 0.40% | +0.70 percentage points |
For session -1, the fitted return is 0.10% + 1.20 × 1.00% = 1.30%, so AR is 2.00% - 1.30% = +0.70 percentage points. The same subtraction gives -0.50 and +0.70 percentage points for sessions 0 and +1. Adding the three values gives CAR[-1,+1] = +0.90 percentage points.
Every input is hypothetical. This result says the stock’s three-session return exceeded the selected market-model benchmark by 0.90 percentage points. It does not say that the announcement caused the entire difference, that the event was economically valuable, or that a similar trade will earn that amount again.
Aggregate events and distinguish CAR from compounding
For N security-event observations, an equal-weighted average abnormal return on event day t is AAR_t = (1/N) Σ AR_i,t. Cumulative average abnormal return over a fixed window is CAAR[τ1,τ2] = Σ AAR_t. This equals the average event-level CAR when each event uses the same dates and equal weights. If events are weighted differently or windows differ, state the aggregation rule.
CAR adds daily ARs; it does not compound them. As a purely mathematical illustration, daily abnormal returns of +10% and -10% sum to a CAR of 0%, while compounding that return path gives (1.10 × 0.90) - 1 = -1%. A buy-and-hold abnormal return instead compares compounded realized performance with a compounded benchmark path. It is a different measure, especially over longer horizons.
Keep the unit of analysis clear. A firm-level CAR describes one security-event pair. CAAR summarizes a sample under its weighting rule. Neither should silently be interpreted as the percentage change in total firm value or as a portfolio’s executable return after costs.
Account for event variance and dependence
A CAR is a point estimate. A significance test also needs a variance estimate and assumptions about how observations relate. Event announcements can change return variance exactly when the test is being evaluated. Boehmer, Musumeci, and Poulsen’s event-induced variance study90032-F) shows why methods that ignore such variance can over-reject a zero-AR null in some settings.
When many firms share an announcement date or common shock, abnormal returns can be correlated across securities. Treating them as independent can understate uncertainty. Kolari and Pynnönen’s cross-sectional-correlation test studies that problem, including clustered event dates. Brown and Warner’s daily-return analysis90042-X) also examines how autocorrelation, event-conditioned variance, and cross-sectional dependence affect daily event-study procedures.
Choose an inference method that matches the event design, sample, and dependence structure. Report the test statistic, standard-error or variance procedure, sample size, event-date clustering, and any small-sample adjustment. If many windows, outcomes, or event definitions were tried, prespecify the main result or account for multiple testing instead of reporting only the most significant result.
Interpret CAR within its limits
A CAR is relative to a model, event definition, return series, sample, and interval. It can reflect anticipation before the announced date, simultaneous company or market news, delayed trading, or misspecification of expected returns. A longer window does not automatically capture more of the event; it can add more confounding information.
An abnormal return is not automatically a causal effect. The normal-return model is a benchmark, not an observed counterfactual showing what the same security would have earned without the event. The correlation-versus-causation guide explains that distinction. A CAR is also not a directional trading signal: evaluate any strategy separately with information timing, out-of-sample rules, liquidity, and execution costs.
For a reproducible report, state the event and timestamp, sample inclusion rules, return convention, benchmark, estimation and event windows, α̂ and β̂ when used, AR and CAR or CAAR, weighting rule, inference method, standard errors, and sensitivity checks. Include negative as well as positive events and report results for the prespecified window. This makes the result interpretable without giving it more causal or predictive meaning than the design supports.
Common questions
Q1Is CAR the same as a stock’s percentage price change?
No. CAR sums abnormal returns after subtracting a chosen normal-return benchmark. Raw price change and compounded buy-and-hold abnormal return use different calculations.
Q2Does a positive CAR prove the announcement caused the gain?
No. CAR is relative to a benchmark model and can include anticipation, concurrent news, or model error. Causal claims need a design that supports them.
Q3Should I use a longer event window?
Only if it fits the question. A wider window can capture delayed reactions or leakage, but it also increases the chance of including unrelated information.
Sources and further reading
Report an issue
We’ll prepare an email with this article link. Mark receives the report only after you send it
Quick check
Read the guide? Check yourself with 3 questions
Question 01
How is a daily abnormal return calculated in a market-model event study?
Choose an answer to see the explanation
Options glossary
A call or put whose strike is near the underlying price; it has little intrinsic value and often substantial sensitivity to time and volatility.
Read the deeper guideCall optionA contract that gives its holder the right, but not the obligation, to buy the underlying at the strike before or at expiration under the contract terms.
Read the deeper guidePut optionA contract that gives its holder the right, but not the obligation, to sell the underlying at the strike before or at expiration under the contract terms.
Read the deeper guide