

Real GDP Growth vs. GDP per Capita Growth
Learn why total real output and real output per person can grow at different rates, how population enters the calculation, and what the average leaves out.
In this guideWhy can GDP growth and GDP-per-capita growth differ?
Short summary
Real GDP growth measures the change in an economy’s total production volume. Real GDP-per-capita growth adjusts that change for population growth, so it describes how the average amount of measured production per resident changed. Neither rate says how much a typical household earned.
Why can GDP growth and GDP-per-capita growth differ?
Real GDP tracks the inflation-adjusted volume of final goods and services produced within an economy. The Bureau of Economic Analysis describes real GDP as a chain-type quantity measure of U.S. production relative to a reference year. {source:beaRealGdpDefinition} GDP-per-capita level divides GDP by a population count. The World Bank, for example, defines its annual GDP-per-capita indicator using midyear population. {source:worldBankGdpPerCapitaDefinition}
The two measures answer related but different questions. Total real GDP asks whether the economy produced more or less overall. Real GDP per capita asks whether measured production grew faster or slower than the population used in the denominator. If population rises, total output can expand while output per person grows more slowly. If population falls, output per person can rise even while total output slips.
The phrase “per capita” means “per person,” but it is an average ratio. It does not mean each person literally receives an equal part of production. The calculation summarizes an economy-wide production flow relative to its population; it does not track individual households.
What is the formula for per-capita growth?
Let real GDP be Y and population be P. GDP per capita is Y divided by P. Over the same two dates, the exact relationship between the growth rates is:
Per-capita growth = (1 + real GDP growth) ÷ (1 + population growth) − 1
Use rates as decimals in the formula: 3% is 0.03 and 1% is 0.01. This ratio is exact when both rates use the same start and end dates and the same population and GDP definitions. For modest changes, people often use the approximation:
Per-capita growth ≈ real GDP growth − population growth
The approximation is useful for a quick mental check, but it is not exact because growth compounds. The exact rate is slightly different when both output and population change. A log-growth decomposition says the same thing in another form: the change in log real GDP per capita equals the change in log real GDP minus the change in log population.
Do not mix the percent change in total GDP with a change in the per-capita level. First identify the two dates, calculate both growth rates over that same interval, and then apply the ratio.
A hypothetical example: 3% GDP growth is not 3% per person
Suppose a real GDP index rises from 100 to 103 over a year. Total real GDP growth is 3%. Over the same year, suppose the relevant population index rises from 100 to 101, or 1%. The new per-capita index is 103 divided by 101, or about 101.98. Per-capita growth is therefore about 1.98%, not 3%.
Subtracting the growth rates gives 3% − 1% = 2%. That is a close approximation here, but the exact calculation is 1.03 divided by 1.01, minus 1, which is about 1.98%. The index values are invented solely to show the arithmetic; they are not data for a country or a forecast.
The comparison also depends on choosing consistent periods. Comparing calendar-year real GDP growth with a population change measured from one midyear date to another can be a reasonable annual convention, but it is not automatically identical to a national statistical agency’s published per-capita series. Check each series’ date and population method.
<!-- learn:illustration -->
When can output per person fall while total GDP rises?
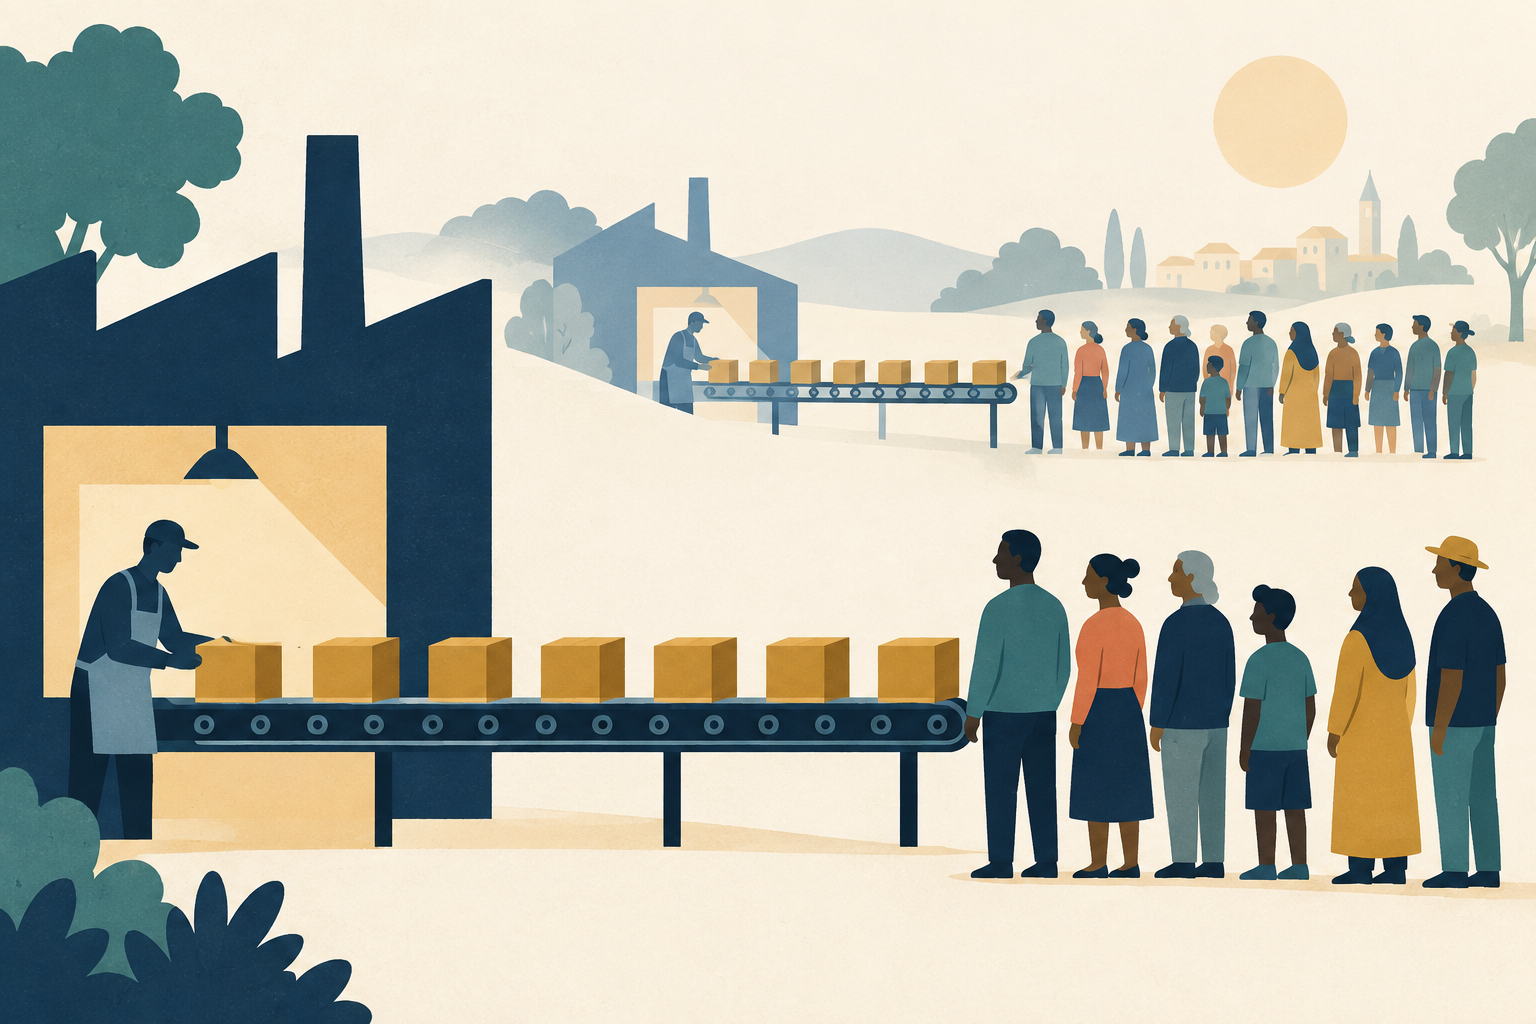
The population growth rate can exceed total real GDP growth. If real GDP rises 2% while population rises 3%, the exact per-capita change is 1.02 divided by 1.03, minus 1, or about −0.97%. Total production grew, but it was spread across a faster-growing population in the arithmetic average.
The reverse can happen when population declines. Suppose real GDP falls 1% and population falls 2%. Per-capita output changes by 0.99 divided by 0.98, minus 1, or about 1.02%. This does not mean the contraction had no cost: total production fell, the average denominator also fell, and the calculation says nothing about who left, who remained, hours worked, public services, or household circumstances. The example is hypothetical.
Population dynamics can therefore widen or narrow the gap between the two rates without changing the definition of real GDP. A country can report positive aggregate growth and negative per-capita growth, or the reverse. State which measure you mean instead of using “the economy grew” as if there were only one relevant rate.
Which population belongs in the denominator?
A per-capita statistic is only as comparable as its population denominator. Annual series often use a midyear population estimate, while other statistical products may use an annual average or a population aligned to a different reference date. The World Bank’s cited indicator explicitly uses midyear population. {source:worldBankGdpPerCapitaDefinition} Do not assume another agency uses the same convention without checking its metadata.
Also check who is counted. A national population estimate can differ according to residence rules, census coverage, treatment of institutional populations, and revisions to births, deaths, or migration estimates. For a simple annual comparison, pair the output and population observations that the published series defines for that year. When building a ratio yourself, document the dates and definitions instead of silently combining series with different coverage.
For quarterly comparisons, annualizing a GDP growth rate does not make the matching population change an annual rate automatically. Use the same comparison interval or convert both measures consistently. If a GDP release compares the latest quarter with the preceding quarter at an annual rate, do not subtract a year-over-year population rate from it. That mixes horizons.
Is GDP per capita the same as productivity?
No. GDP per capita divides production by the whole population covered by the statistic. Labor productivity usually measures output per hour worked or per worker. The total population includes people who are not employed, such as children, retirees, students, caregivers, and people between jobs. A change in GDP per capita can reflect output, demographics, employment, hours, or several factors at once.
Output per hour is closer to a measure of how much production is associated with labor input, but it is not interchangeable with output per person. A country could raise GDP per capita because more residents enter paid work, because hours worked change, because output per hour rises, or because the age mix changes. A per-capita ratio alone cannot separate those channels. For that decomposition, compare it with labor-force, hours, employment, and productivity measures such as labor productivity and multifactor productivity.
When the production and workforce boundaries line up, the ratio can be rearranged as: GDP per person = output per hour × hours per employed person × employed people per population. This identity helps organize the channels; it does not tell you which one caused a change. A higher employment share or longer average hours can raise output per person even if output per hour is unchanged. When linking national GDP to labor statistics, check whether their worker and geographic definitions align.
Does faster GDP-per-capita growth mean the typical person is better off?
It can be one useful signal of average production, but it is not a direct measure of the typical person’s income or living conditions. GDP records production within an economy. Some of the income generated can accrue to businesses, governments, or nonresidents; conversely, residents can receive income from production abroad. The World Bank’s comparison of GDP and gross national income explains this production-versus-resident-income distinction. {source:worldBankGdpGniConcepts} GDP per capita also does not show how output or income is distributed. The OECD describes GDP per capita as a useful benchmark while emphasizing that production-based averages do not capture all dimensions of well-being. {source:oecdGdpPerCapitaLimits}
Imagine two hypothetical economies with the same increase in GDP per capita. In one, production-related income rises broadly across households. In the other, most of the increase accrues to a small group or to owners outside the resident population. The average production ratio can be similar even though household experiences differ. To examine resident income, compare GDP with GNI; to examine households, use household income and distribution measures. See GDP, GNI, and GNP.
Real GDP per capita also leaves out unpaid work, leisure, health, safety, environmental costs, and the value of activities outside GDP’s production boundary. It is not a comprehensive welfare score. It is a useful average output indicator when the question is clearly about production per person.
How should I compare a reported growth rate?
Before interpreting a number, check five details:
- Is the output measure real or nominal?
- Is the figure total GDP or GDP per capita?
- Which exact dates and growth convention are being compared?
- What population definition and reference date are used?
- Are the figures estimates from the same release vintage?
For a change over time within one country, real GDP and a matching population series can show whether average measured production per person rose or fell. The World Bank’s definition is one example of a stated population convention; other providers should be checked separately. For the difference between nominal and inflation-adjusted output, see nominal vs. real GDP. Labor-market rates use narrower population groups and answer different questions; see labor-force participation and the employment-population ratio.
For comparisons across countries, distinguish growth from level. Growth compares changes through time; a per-capita level compares production per person at a point or period. Cross-country level comparisons need consistent currency, price basis, and purchasing-power adjustments; the World Bank explains why purchasing-power parities are used for such comparisons and where they have limits. {source:worldBankIcpPppUses} A higher per-capita GDP level does not by itself establish a higher median household income or prove that residents receive the full value of domestic production.
Common questions
Q1Is GDP per capita just GDP growth minus population growth?
That subtraction is a close approximation for small growth rates. The exact relationship compounds both changes: divide one plus the GDP growth rate by one plus the population growth rate, then subtract one. Use matching dates and definitions for both series.
Q2Can GDP per capita rise during a recession?
Yes. Total GDP can fall while population falls by a larger percentage, causing the ratio to rise. That arithmetic result does not show that every resident is better off or that the recession had no adverse effects.
Q3Is GDP per capita the average income of residents?
No. GDP measures production within an economy, not income received by each resident. GDP per capita divides that production measure by population; it does not reveal who receives income or what the median household earns.
Sources and further reading
Report an issue
We’ll prepare an email with this article link. Mark receives the report only after you send it
Quick check
Read the guide? Check yourself with 3 questions
Question 01
Real GDP grows 3% while the matching population measure grows 1%. What is the approximate real GDP-per-capita growth rate?
Choose an answer to see the explanation