

Disinflation vs. Deflation: When Falling Inflation Does Not Mean Falling Prices
Learn how a slower inflation rate differs from a broad decline in prices, read CPI and PCE changes, and check what a falling rate says about the price level.
In this guideInflation, disinflation, and deflation describe different changes
Short summary
Disinflation means the inflation rate has slowed while the measured price level is still rising. Deflation means a broad price index has declined persistently across measured periods. A smaller positive rate is still inflation; it does not mean the overall basket has become cheaper.
Inflation, disinflation, and deflation describe different changes
Inflation is a sustained rise in the broad price level: the average prices represented by an index move upward over time. The inflation rate describes how quickly that index is changing during a specified period. It is a rate of change, not the index level itself.
Disinflation is a decline in the inflation rate while that rate remains positive. If inflation slows from 4% to 1%, prices in the measured basket are still rising, just more slowly than before. Deflation is a general, sustained decline in the price level; the measured inflation rate is negative for the period and index being discussed. The St. Louis Fed explains these three terms and shows why they should not be used interchangeably in its guide to [inflation, disinflation, and deflation]({source:stlouisInflationDisinflationDeflation}).
The distinction answers two separate questions: Did the price level rise or fall, and did its rate of change accelerate or slow? A headline saying “inflation fell” often refers to the second question. It may describe disinflation even if the overall index is still increasing.
A price index summarizes a defined basket
An index tracks price changes for a defined set of goods and services. The U.S. Consumer Price Index (CPI) measures the average change over time in prices paid by urban consumers for a representative market basket. The CPI is one measure of consumer inflation, not a promise that every household buys the same basket or experiences the same change. The Bureau of Labor Statistics describes the CPI’s scope in its [CPI FAQs]({source:blsCpiFaq}) and [methodology overview]({source:blsCpiConcepts}).
The Personal Consumption Expenditures (PCE) price index is another measure. The Bureau of Economic Analysis defines it as an index of prices for goods and services purchased by, or on behalf of, persons. CPI and PCE have different coverage and weights, so their measured rates can differ without either calculation being an arithmetic error. See the BEA’s [PCE price index definition]({source:beaPcePriceIndex}) and compare the measures in CPI vs. PCE vs. the GDP deflator.
Because an index summarizes many prices, it can rise even while some of its items become cheaper. A household’s rent, food, or energy costs may move differently from the broad index. The index answers a defined average-price question; it is not a personal cost-of-living statement for every reader.
BLS index values are normalized to a chosen base period. A value of 100 is a reference point, not a price of $100; a value of 120 means the series is 20% above its own base. Different series can use different baskets and base periods, so compare percentage changes over the same interval instead of comparing raw CPI and PCE index levels. The BLS describes how to interpret [CPI index values]({source:blsCpiConcepts}).
Calculate the difference with one hypothetical index
Suppose a made-up price index starts at 100. It rises to 104 over a year. The change is (104 ÷ 100 − 1) × 100 = 4%, so the measured price level rose 4% during that interval.
Suppose the index then moves from 104 to 105.04. Its next-period inflation rate is (105.04 ÷ 104 − 1) × 100 = 1%. The rate has slowed from 4% to 1%, but the index still rose. That is disinflation, not deflation. The index is now 5.04% above its original level of 100.
The two period rates compound because each applies to the level reached at the end of the prior period. After the first 4% increase, the index is 104; 1% of 104 is 1.04, bringing it to 105.04. The cumulative increase is 5.04%, not the simple sum of 4% and 1%. A smaller positive rate still adds to the price level.
For a separate hypothetical interval, let the index fall from 105.04 to 103.9896. The change is (103.9896 ÷ 105.04 − 1) × 100 = −1%, a negative rate for that interval. One negative interval by itself does not establish sustained deflation; that term describes a broad price decline that persists across the measured periods. Even after this hypothetical one-period decline, the index remains above its starting point of 100, so the earlier increases have not been erased. The St. Louis Fed’s [worked examples]({source:stlouisInflationDisinflationDeflation}) use the same rate-versus-level distinction.
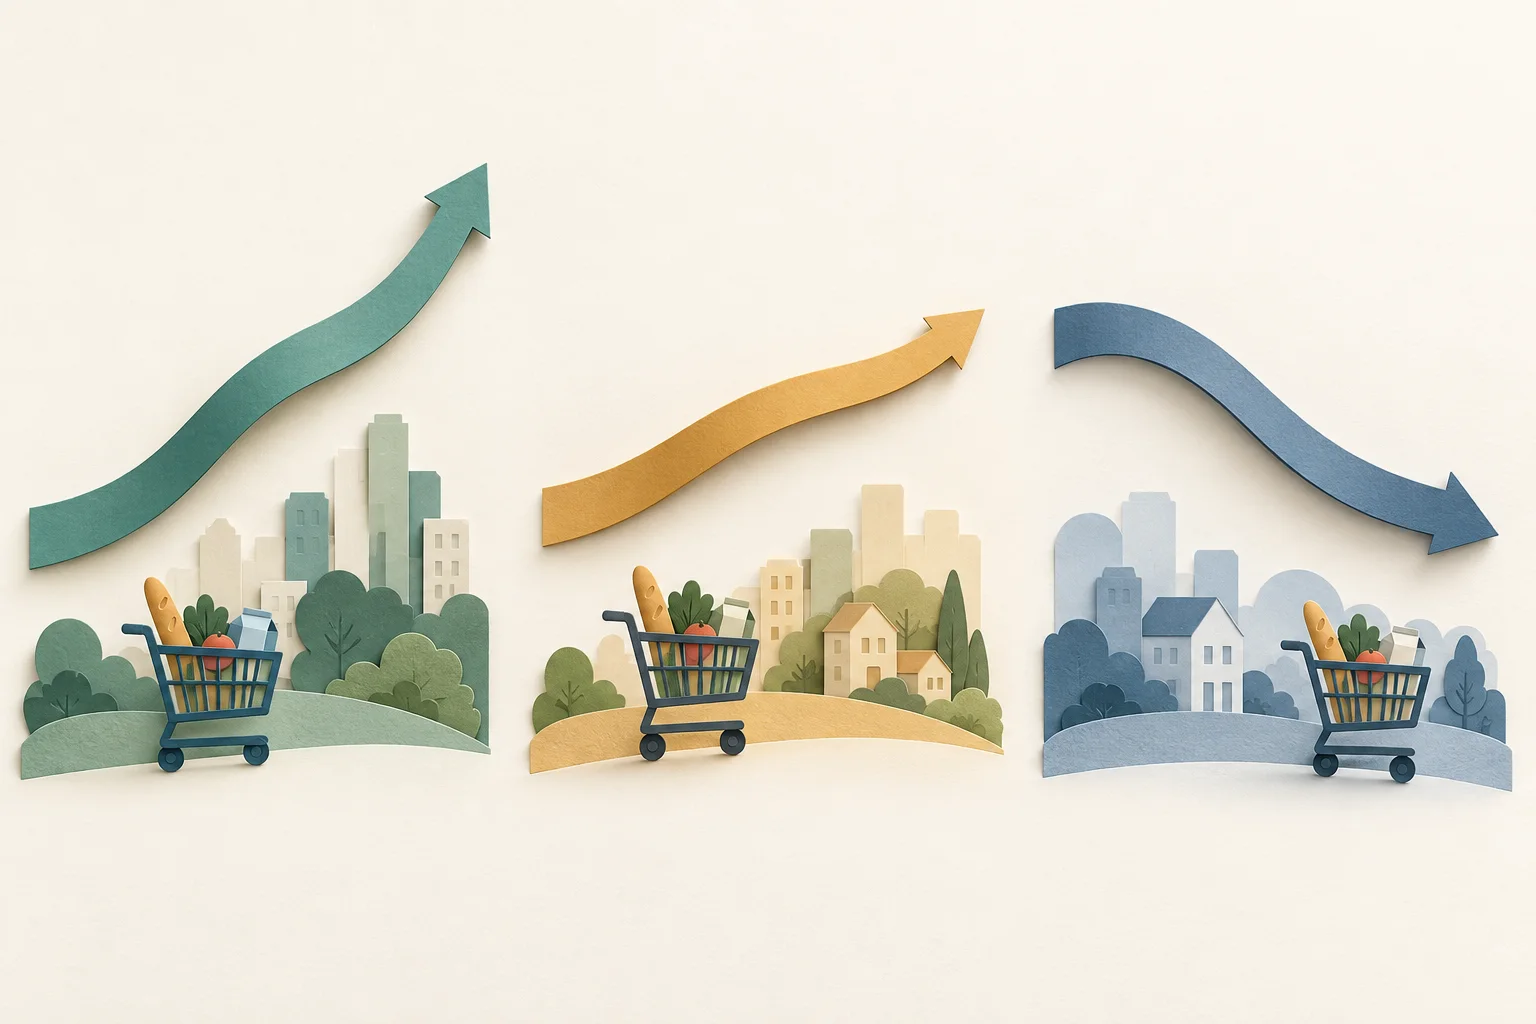
A falling annual rate can coexist with a rising current index
Year-over-year inflation compares an index with its level twelve months earlier. The comparison month changes as time passes, so the annual rate can fall even when the current index has risen since the previous month. This is sometimes called a base effect: the earlier comparison value changes, affecting the percentage calculation.
For example, suppose a hypothetical May index is 100 one year earlier and 104 this May. The May year-over-year rate is 4%. In June, imagine the index from the prior June was 102 and the current June index is 105. The new year-over-year rate is (105 ÷ 102 − 1) × 100, or about 2.94%. Yet the current index rose from 104 in May to 105 in June. The annual rate slowed because the comparison now uses a higher earlier reading.
The St. Louis Fed’s explanation of [why the inflation rate can fall while prices rise]({source:stlouisPriceLevelInflationRate}) walks through this distinction. When reading a release, check whether the reported change is month over month, year over year, or another interval. A slower annual rate is not a direct report that this month’s prices declined.
In the same hypothetical example, the one-month index change from 104 to 105 is (105 ÷ 104 − 1) × 100, or about +0.96%, while the year-over-year rate is about 2.94%. Both are positive changes, but they compare different pairs of months. A rate can move in a different direction from the latest one-month change because the annual comparison replaces an older month with a new one.
One falling price is not broad deflation
Prices for individual products and services move for many reasons. A product can become cheaper after productivity improves, a supply constraint eases, demand shifts, or its quality changes. Other prices may rise at the same time. A price drop in one category can therefore coexist with inflation in a broad index.
Deflation refers to a broad decline in the general price level, not every individual price falling at once. The BLS describes the CPI as an average across a market basket, and its [CPI concepts]({source:blsCpiConcepts}) explain the population and price scope behind that measure. When a news report uses “deflation,” identify which broad index it means and whether the decline persists across the period being discussed.
The reverse is also true: inflation does not mean every price is increasing. It describes the net movement of a defined index. That is why one grocery receipt, one rent renewal, or one sale price cannot by itself establish inflation or deflation for the economy as a whole.
Deflation can change the burden of fixed nominal debts
Broad, sustained deflation can matter beyond the checkout line. If a borrower owes a fixed number of dollars while prices, wages, or business revenues fall, those dollars may become harder to repay from income. The real burden of a fixed nominal debt can rise even though the contract’s dollar balance has not changed.
The Federal Reserve has described this debt-service channel in its discussion of [deflation risks]({source:fedDeflationDebtBurden}).
That is a possible channel, not a guarantee that every bout of falling prices creates a downturn or a self-reinforcing spiral. Effects depend on why prices are falling, how wages and incomes respond, contract terms, and policy conditions. Some relative prices fall because supply or productivity improves; that does not by itself establish economy-wide deflation. Treat historical mechanisms as context rather than as a forecast for a current economy.
Disinflation also has more than one interpretation. Slower price growth can reduce the pace at which purchasing power is eroded, while the cost level already reached remains in place. The phrase does not say whether real wages, household budgets, or a particular person’s expenses have improved. For purchasing power and inflation-adjusted returns, see nominal vs. real returns.
A 2% policy goal is not the definition of disinflation
The U.S. Federal Open Market Committee (FOMC) judges that 2% inflation over the longer run, measured by the annual change in the PCE price index, is most consistent with its mandate. That is a U.S. monetary-policy goal. It is not the universal definition of stable prices, and it is not a cutoff that separates disinflation from deflation. The Federal Reserve explains its reasoning in [Why does the Federal Reserve aim for inflation of 2 percent over the longer run?]({source:fedTwoPercentGoal}).
If a measured rate moves from 5% to 3%, that is disinflation even though it remains above 2%. If it moves from 1% to 0.5%, it is still positive inflation and still disinflation if the rate has slowed. If the selected index falls over the stated interval, its measured rate is negative for that interval. These labels describe the observed rate and index; they do not by themselves judge whether the outcome is desirable.
Other countries and central banks may choose different targets, indexes, and policy frameworks. Keep the description tied to the named index, period, and jurisdiction. A U.S. PCE target should not be applied as though it were a rule for every country’s CPI or household budget.
Read an inflation headline without confusing the rate and level
Start with the index: Is the report about CPI, PCE, or another measure, and whose prices does it cover? Then check the comparison period and whether the figure is headline or a narrower measure such as core inflation. The labels tell you which average-price change the number represents.
Next, separate the rate from the level. A falling but positive rate means prices in the measured index are still rising more slowly. A negative rate means that index fell over that period. Neither statement tells you that every price moved the same way, that the index returned to an older value, or that a particular household’s budget changed by the headline rate.
For a concise summary, name the index, period, and sign of the change: “The hypothetical year-over-year CPI rate slowed from 4% to 1%, while the index continued to rise.” That sentence describes disinflation without implying prices fell. It also leaves room to distinguish the CPI from PCE, and broad price changes from the experience of one household. For how price changes are separated from real output growth, see nominal vs. real GDP.
Common questions
Q1Does lower inflation mean prices are falling?
No. If the rate falls from 4% to 1%, the price index is still rising, just more slowly. Prices in the broad index are falling only when the measured rate is negative for the stated interval.
Q2Does deflation mean prices have returned to their earlier level?
Not necessarily. An index can fall in one period and still remain above where it began before earlier increases. Check the index values as well as the rate.
Q3Does a cheaper product prove that the economy is in deflation?
No. Individual prices can fall while other prices rise. Deflation refers to a broad, sustained decline in a defined price measure, not a single product or household expense.
Sources and further reading
Report an issue
We’ll prepare an email with this article link. Mark receives the report only after you send it
Quick check
Read the guide? Check yourself with 3 questions
Question 01
A broad price index rises, but its annual rate slows from 4% to 1%. What does that describe?
Choose an answer to see the explanation
Options glossary
Clear definitions of essential option terms, from calls, puts, and option chains to IV, Greeks, open interest, and max pain
Browse the options glossary